Version
5.1.2
Reproduction link
https://jsfiddle.net/b1kcr42a/1/
Steps to reproduce
Create a stacked chart with several data series. Sometimes there will be a visual glicth that appears to bridge the end and start points of a series in the chart. Sometime this will occur for many series.
What is expected?
The stacked chart draws without issues
What is actually happening?
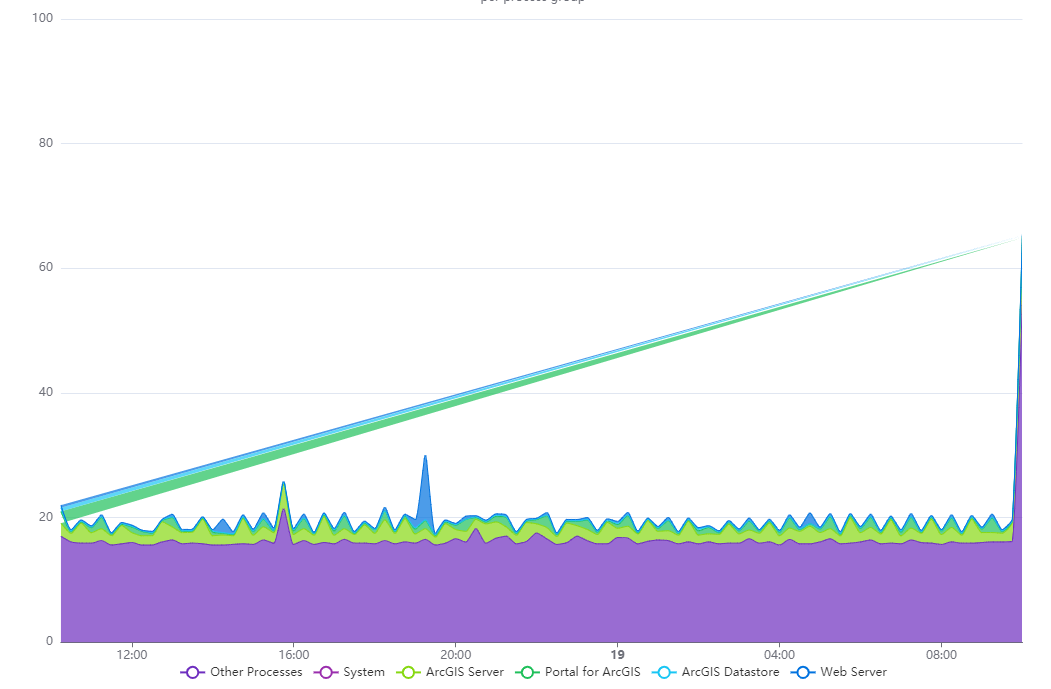
A visual glitch that appears to bridge the end and start points of a series
This problem occurs in 5.1.2 but not in 5.0.0 - I havent not tested version in between.
5.1.2
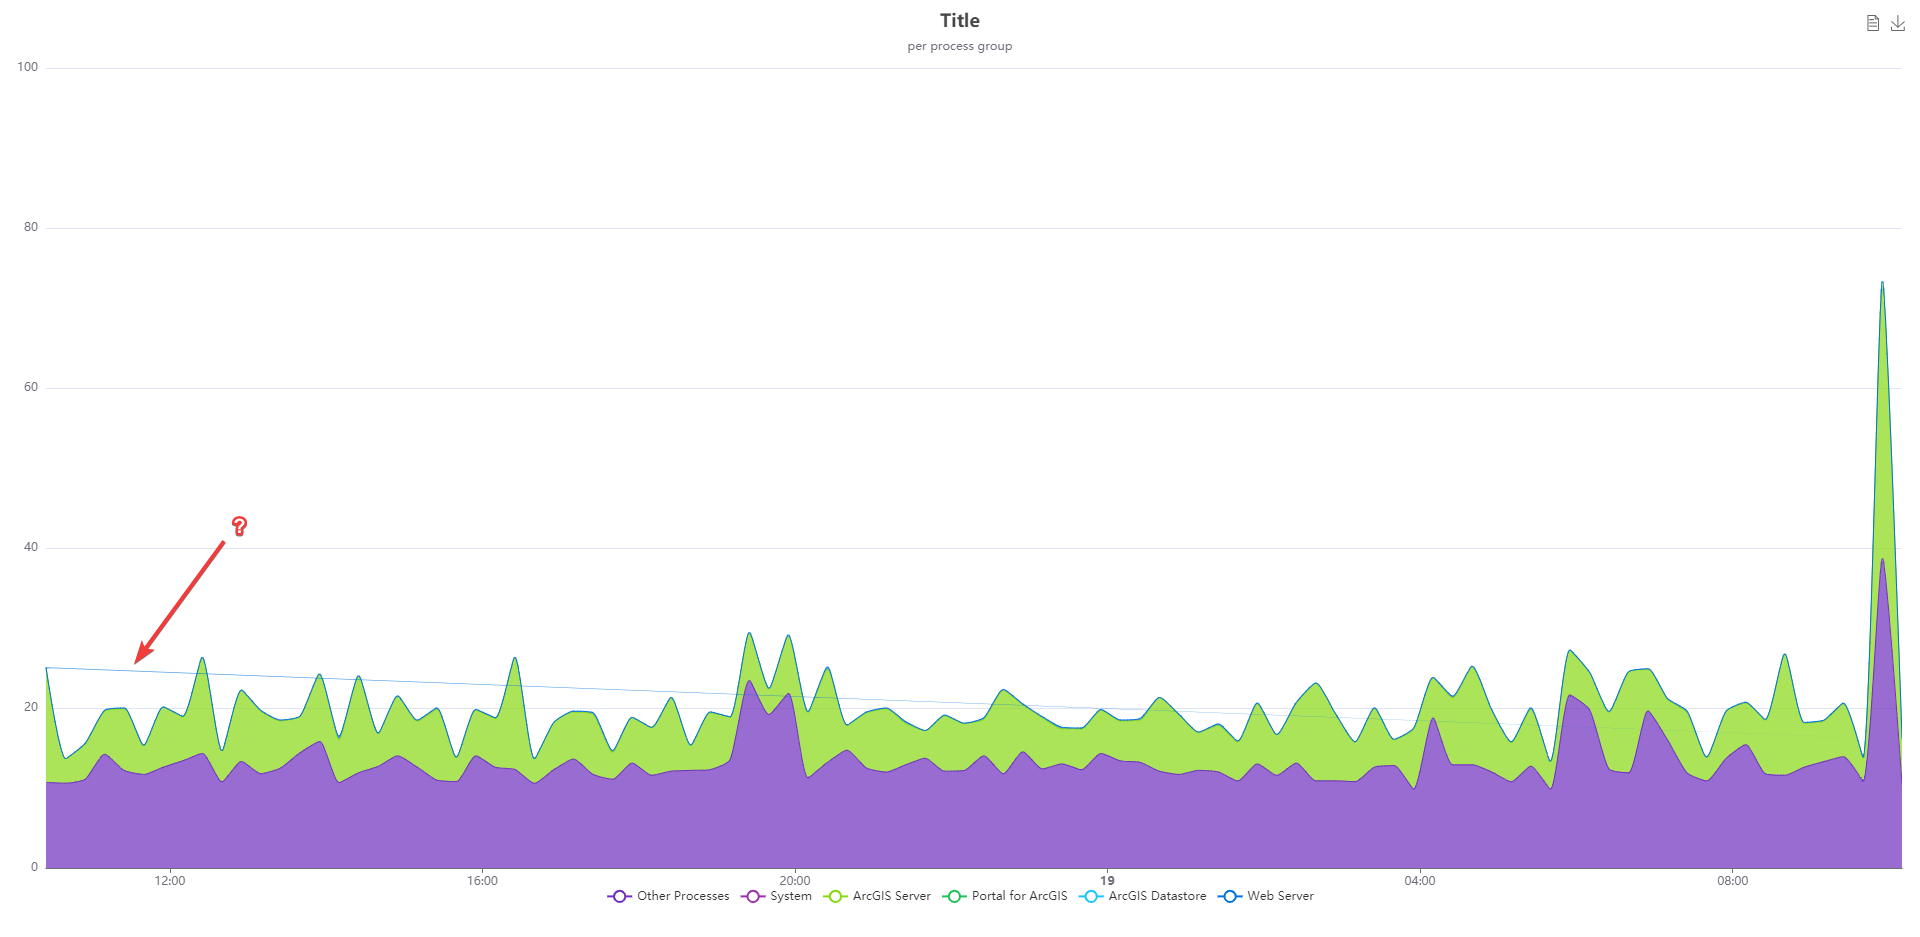
5.0.0

Version
5.1.2
Reproduction link
https://jsfiddle.net/b1kcr42a/1/
Steps to reproduce
Create a stacked chart with several data series. Sometimes there will be a visual glicth that appears to bridge the end and start points of a series in the chart. Sometime this will occur for many series.
What is expected?
The stacked chart draws without issues
What is actually happening?
A visual glitch that appears to bridge the end and start points of a series
This problem occurs in 5.1.2 but not in 5.0.0 - I havent not tested version in between.
5.1.2

5.0.0
