Improvements to the Usage Statistics page and graphs #2343
Description
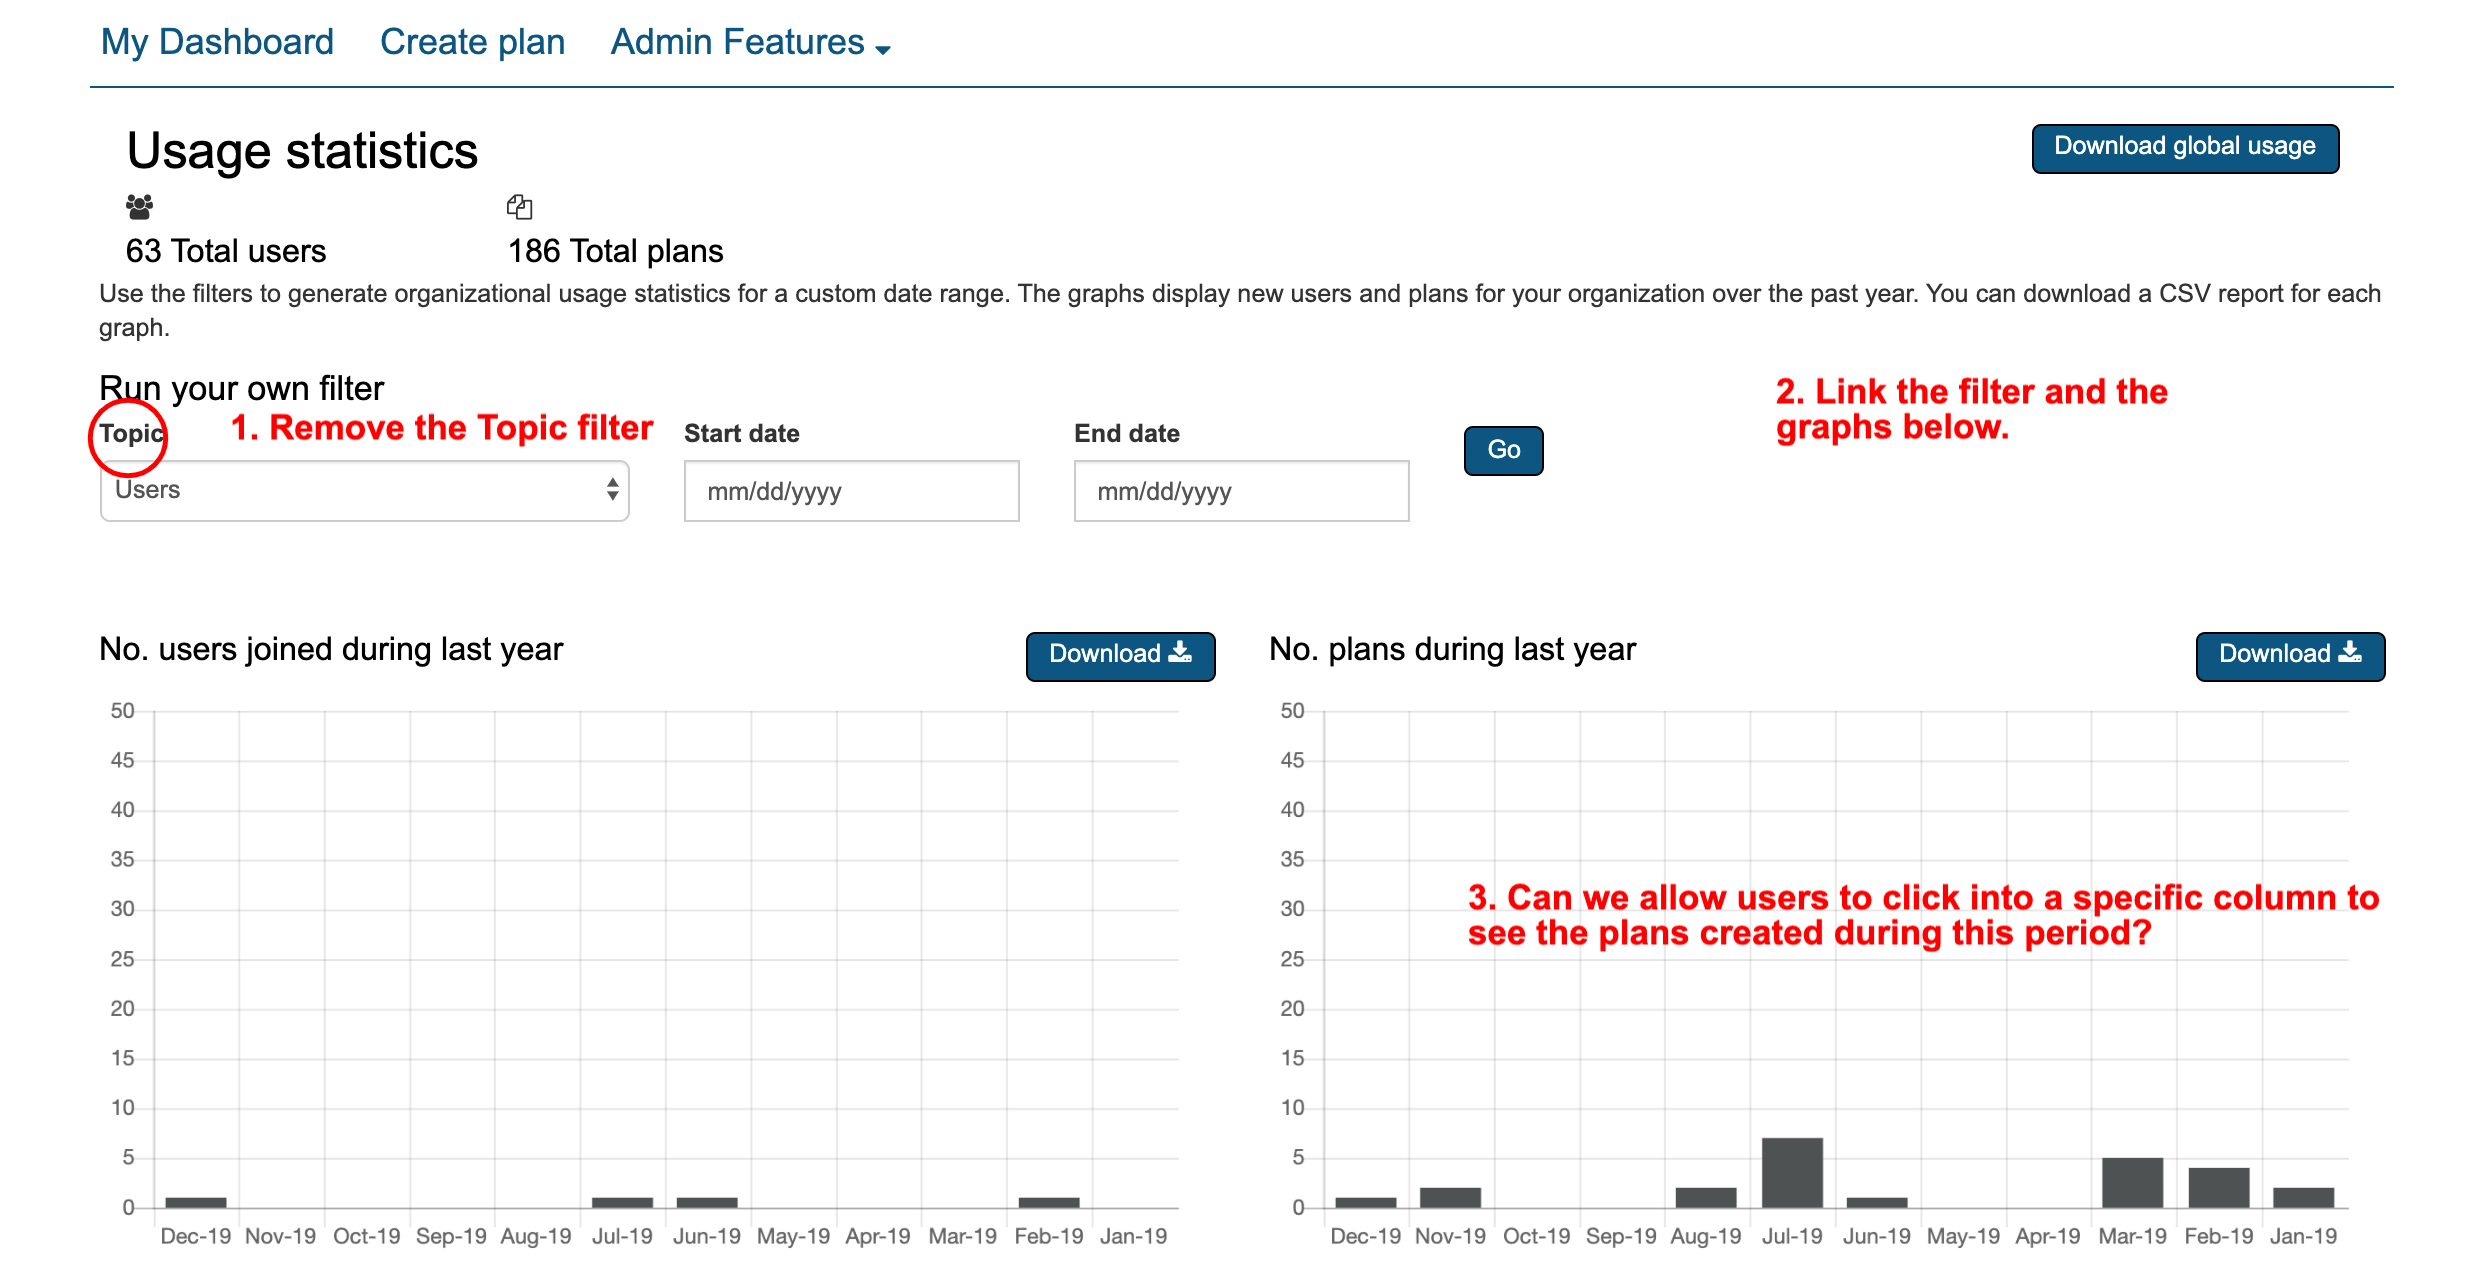
The current Usage Statistics page layout is not intuitive and it is not obvious that the filter is not connected to the graphs below.
We propose that the filter lets the admin define settings which are then visualized in graphs, with possibility to click through to get more information / interrogate the underlying data.
This involves:
- linking the filter and graphics below
- Remove the "Topic" from the filter. Users will then only be able to select a date span.
- Investigate JS library through which charts are created to see if we can offer a click through experience to investigate the underlying data
This issue builds on #1678.