Feature: Add support for Datetime min & max in ChartTimeLine#170
Feature: Add support for Datetime min & max in ChartTimeLine#170PrzemyslawKlys merged 15 commits intoEvotecIT:masterfrom
Conversation
Add support for tooltip
# Conflicts:
#	PSWriteHTML.psd1
|
I've added an example and some autodetection of type. I wonder if you have any more examples that are possible with this one? Otherwise, the code looks great. |
|
I'm happy. The example I can think of is one where we don't set min & max, but that will just be like example you, with only the tooltip as a difference. |
|
BTW - I might add an example for the TimeZoneOffset parameter. Will do that tonight. |
|
I wonder if it's possible to make it a bit more autodetect for timeline with chart X. For example it would get the data that is set in the "timeline" and use that for min/max. |
|
I also wonder if it's possible to display a message similar to tooltip directly without hover - so it's always displayed. |
|
If you don't use min & max, it will auto detect the scale, plus/minus some "padding" / "Margin" to each side. If you want it to "zoom" based on the data, I would argue that is beyond what we should handle. If people are going to request it, we can see if we can solve it in a smart way. Something like an after burner script block that samples the data points and find min & max based on that. |
|
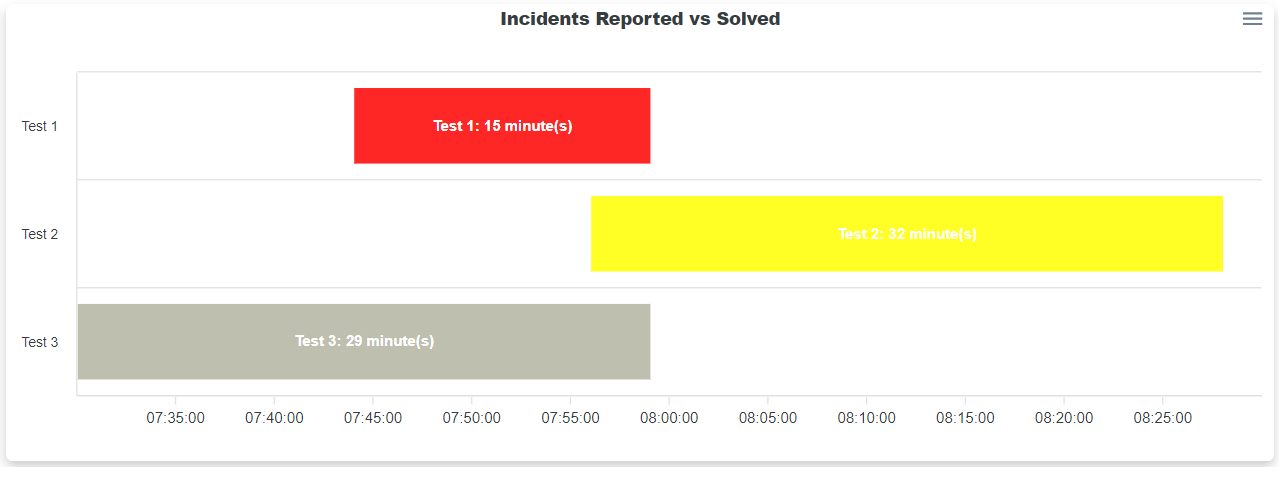
I see - this works New-HTMLPanel {
New-HTMLChart -Title 'Incidents Reported vs Solved' -TitleAlignment center {
New-ChartTooltip -TitleText 'Timeline' -XAxisFormatPattern 'HH:mm:ss'
New-ChartAxisX -Type 'datetime'
$From = (Get-Date).AddMinutes(15)
$To = (Get-Date).AddMinutes(30)
New-ChartTimeLine -DateFrom $From -DateTo $To -Name 'Test 1' -Color Red
$From = (Get-Date).AddMinutes(27)
$To = (Get-Date).AddMinutes(59)
New-ChartTimeLine -DateFrom $From -DateTo $To -Name 'Test 2' -Color Yellow
$From = (Get-Date).AddMinutes(1)
$To = (Get-Date).AddMinutes(30)
New-ChartTimeLine -DateFrom $From -DateTo $To -Name 'Test 3' -Color Beige
}
}But maybe we should try to set Type of chart automatically if New-ChartTimeline is used. I believe we do that for bar charts and other type of charts. |
|
It would be cool if this: New-HTMLPanel {
New-HTMLChart -Title 'Incidents Reported vs Solved' -TitleAlignment center {
$From = (Get-Date).AddMinutes(15)
$To = (Get-Date).AddMinutes(30)
New-ChartTimeLine -DateFrom $From -DateTo $To -Name 'Test 1' -Color Red
$From = (Get-Date).AddMinutes(27)
$To = (Get-Date).AddMinutes(59)
New-ChartTimeLine -DateFrom $From -DateTo $To -Name 'Test 2' -Color Yellow
$From = (Get-Date).AddMinutes(1)
$To = (Get-Date).AddMinutes(30)
New-ChartTimeLine -DateFrom $From -DateTo $To -Name 'Test 3' -Color Beige
}
}Just worked. Both type wise/tooltip wise. Not sure if tooltip is possible, but surely the type choice yes. |
|
This is what I'm thinking of (so white text on each timeline)
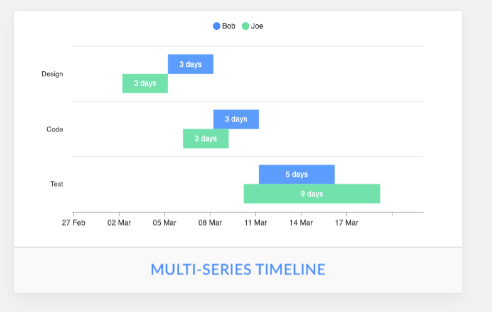
It would be great to support: https://apexcharts.com/javascript-chart-demos/timeline-charts/ grouped rows and multiple ranges on the same timeline as well, but we don't have to do it in one go. Maybe added What do you think? |
|
I'm all in to do it right. But I might not fully understand how I could support My overall plan is to support multi series in 1-2 weeks. I'm more than happy to look into the permanent text inside the bar, and see how it can co-exists with tooltip. |
|
My thinking is you can set it permanently in } elseif ($Setting.ObjectType -eq 'TimeLine') {
$Type = 'rangeBar'
$DataSetChartTimeLine.Add($Setting.TimeLine)You would probably need to check if ChartX already exists, and somehow manage that. Eventually I think it would be more secure (less problematic) to do it in if ($ChartAxisX) {
New-ChartInternalAxisX -Options $Options @ChartAxisX
}to something like: if ($ChartAxisX) {
if ($ChartAxisX.Type -ne 'datetime')...
New-ChartInternalAxisX -Options $Options @ChartAxisX
} else {
# Missing definition lets fix it...
$ChartAxisX
}I think the 2nd option is less problematic and deals with chartX in last possible moment. So in this place you would also address any missed settings i guess? |
Supports:
Missing New-ChartAxisX
Missing Datetime as type on New-ChartAxisX
|
We should now support your scenario with missing x axis and wrongly time, based on your second suggestion. |
|
Should we move forward with this PR? It seems to add new features and will work on its own. I'm testing with the data labels, to have something in place for that. Will do a separate PR for that, when I know more. |
|
Looks good. I'm actually playing with labels as well :-) Wanted to add "something". Lemme do check-in soon and then we can accept PR and keep working separately on new features. |
|
I have a full working example in javascript / html for the labels, that will work with this PR. I was thinking that we should offer all resolutions possible, so people don't have to write java script functions. On top of that I'm going with the luxon package, because the moment package is not active any more (from the original example). |
|
|
|
Looks great - so I added New-ChartDataLabel... you can take a look. It's missing formatter tho. |
|
Moment.js package is used in DataTables too. Are you saying its deprecated? |
|
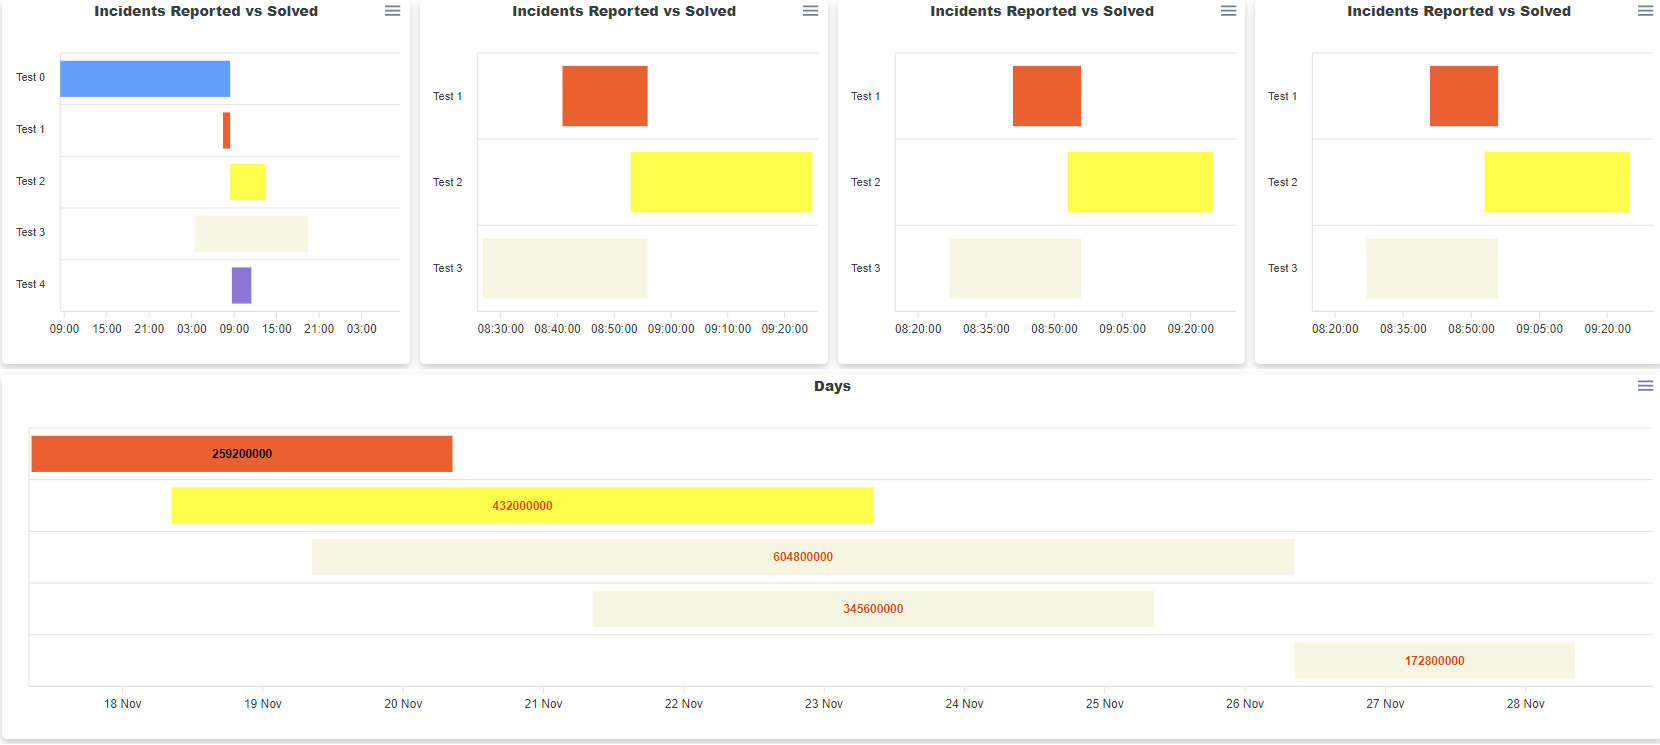
I've added New-CHartDataLabel and was testing if disabling Y-axis would work. Basically trying to replicate: https://apexcharts.com/javascript-chart-demos/timeline-charts/distributed/
We need to somehow make it easy for users to switch between different formats. I don't expect people to know anything about formatting - it needs to be easy to switch between dates/hours. |
| $Object = [PSCustomObject] @{ | ||
| ObjectType = 'DataLabel' | ||
| DataLabel = [ordered] @{ | ||
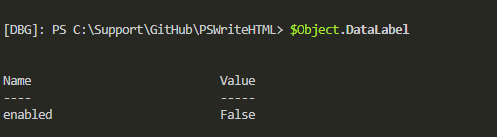
| enabled = $Enabled.IsPresent |
There was a problem hiding this comment.
This will always make it enabled.
-Enabled
-Enabled:$true
-Enabled:$false
Will all validate $Enabled.IsPresent to true.
You should just do:
enabled = $Enabled
There was a problem hiding this comment.
Mmm, no it won't, as far as my testing goes.
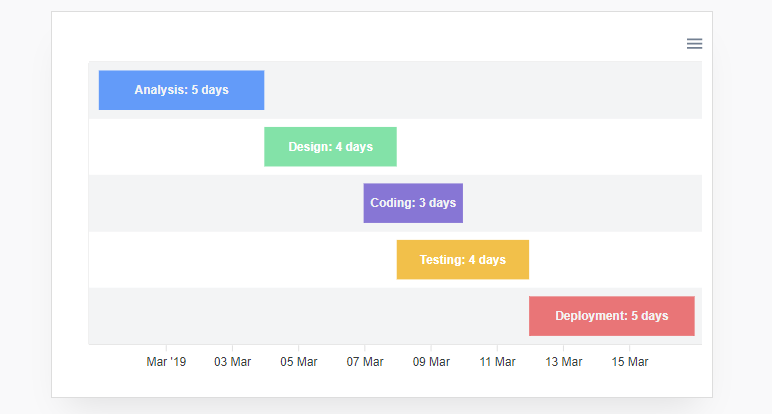
New-HTMLChart -Title 'Days' -TitleAlignment center {
New-ChartAxisY # this hides AXIS Y
New-ChartDataLabel -Enabled:$false -DataLabelsColor Black, Red, Red, Red, Red
$From = (Get-Date).AddDays(-1)
$To = (Get-Date).AddDays(2)
New-ChartTimeLine -DateFrom $From -DateTo $To -Name 'Analysis' -Color Red
$From = (Get-Date).AddDays(0)
$To = (Get-Date).AddDays(5)
New-ChartTimeLine -DateFrom $From -DateTo $To -Name 'Design' -Color Yellow
$From = (Get-Date).AddDays(1)
$To = (Get-Date).AddDays(8)
New-ChartTimeLine -DateFrom $From -DateTo $To -Name 'Coding' -Color Beige
$From = (Get-Date).AddDays(3)
$To = (Get-Date).AddDays(7)
New-ChartTimeLine -DateFrom $From -DateTo $To -Name 'Testing' -Color Beige
$From = (Get-Date).AddDays(8)
$To = (Get-Date).AddDays(10)
New-ChartTimeLine -DateFrom $From -DateTo $To -Name 'Deployment' -Color Beige
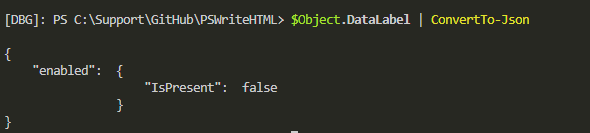
}The problem with leaving it as $Enabled (which is easier to work with) is that when it's converted to JSON it creates something else
There was a problem hiding this comment.
I stand corrected. I had some guy show me way back in 5.1, that IsPresent was going to give me false results. Let me see if I can recreate it...
|
Reading this, and all the connected posts: Says that you should pick something else than moment. Luxon seems to be the first choice from the creators of Moment. I agree on the formatter, that is what I want to solve with a parameter and simple write all formatter examples into the module. |
|
That would be great! Ok, so adding new "library" is done by modifying Parameters.Configuration.ps1 file You would create something like this: Moment = @{
Comment = 'Momment JS Library'
Header = @{
JSLink = 'https://cdnjs.cloudflare.com/ajax/libs/moment.js/2.27.0/moment.min.js'
JS = "$PSScriptRoot\..\Resources\JS\moment.min.js"
}
}And then if users uses a cmdlet that "requires" that library you simply do it like this: $Script:HTMLSchema.Features.Moment = $trueDepending where you need to put the library (header or Footer) you modify this accordingly. as you notice there is JSLink and JS. JSLink is used when -Online mode for HTML is used. JS is when using it offline so it will take file content from JS folder. At the bottom of Parameters.Configuration.ps1 you will notice commented out Refreshes libraries code <# Refreshes libraries
$Keys = $Script:Configuration.Features.Keys
$Keys = 'DataTables', 'VisNetwork', 'VisTimeline', 'Moment', 'FontsAwesome', 'Jquery', 'DataTablesSearchFade', 'Popper', 'ChartsApex'
$Keys = 'ChartsApex'
$Keys = 'ChartsOrg', 'ChartsOrgExportPDF', 'ChartsOrgExportPNG'
$Keys = $Script:Configuration.Features.Keys | Where-Object { $_ -like 'DataTable*' }
$Keys = 'ChartsApex', 'VisNetwork', 'VisTimeline', 'VisData'
$Keys = @(
'DataTables', 'DataTablesSearchFade', 'DataTablesAutoFill', 'DataTablesButtons', 'DataTablesButtonsHTML5', 'DataTablesButtonsPrint',
'DataTablesButtonsPDF', 'DataTablesButtonsExcel', 'DataTablesColReorder', 'DataTablesFixedColumn', 'DataTablesFixedHeader', 'DataTablesKeyTable',
'DataTablesRowReorder', 'DataTablesRowGrouping', 'DataTablesResponsive', 'DataTablesScroller', 'DataTablesSearchPanes'
)
$Keys = 'AccordionFAQ'
$Keys = 'ChartsApex', 'VisNetwork', 'VisTimeline', 'VisData'
foreach ($Key in $Keys) {
if ($($Script:Configuration).Features.$Key.Header.JsLink -and $($Script:Configuration).Features.$Key.Header.Js) {
Save-Resource -ResourceLinks $($Script:Configuration).Features.$Key.Header.JsLink -Type 'JS' -Target $($Script:Configuration).Features.$Key.Header.Js
}
if ($($Script:Configuration).Features.$Key.Header.CssLink -and $($Script:Configuration).Features.$Key.Header.Css) {
Save-Resource -ResourceLinks $($Script:Configuration).Features.$Key.Header.CssLink -Type 'CSS' -Target $($Script:Configuration).Features.$Key.Header.Css
}
}
#>It's an easy way to download required CSS/JS code from online resources. If I would like to refresh offline JS code for moment library I would just do: $Keys = 'Moment'
foreach ($Key in $Keys) {
if ($($Script:Configuration).Features.$Key.Header.JsLink -and $($Script:Configuration).Features.$Key.Header.Js) {
Save-Resource -ResourceLinks $($Script:Configuration).Features.$Key.Header.JsLink -Type 'JS' -Target $($Script:Configuration).Features.$Key.Header.Js
}
if ($($Script:Configuration).Features.$Key.Header.CssLink -and $($Script:Configuration).Features.$Key.Header.Css) {
Save-Resource -ResourceLinks $($Script:Configuration).Features.$Key.Header.CssLink -Type 'CSS' -Target $($Script:Configuration).Features.$Key.Header.Css
}
}and it would download JSLink content to JS path. If there are more than 1 links it will go thru all of them, but you need to provide same number of paths to download it to. Hope it explains. |
|
Should I merge the PR and you will follow with rest in another PR or you want to change something? |
|
Just merge - so we get some traction. Then I'll do another PR for the datalabel stuff. |
|
Done. Thank you very much! |
|
Thank you for helping me out and guide me, so I could get what I need into your module. This is truely a Win-Win 🤘 |
Add support for tooltip as well.
I'm going to add the Example later today. But now you can review the code and we can discuss from here what needs to be changed and if we need to refactor some other stuff.
As said - I'm up for helping where I can.