Issue with plotEmbedding with GeneExpressionMatrix #1452
Description
Hi - I've encountered an issue using plotEmbedding with GeneExpressionMatrix to visualize expression of genes of interest in UMAP space on my dataset of integrated scATAC and scRNA data from a 10x Multiome experiment. The function works as expected for most of my genes of interest, but for a few examples, I get a blank plot, as seen below (with log file attached).
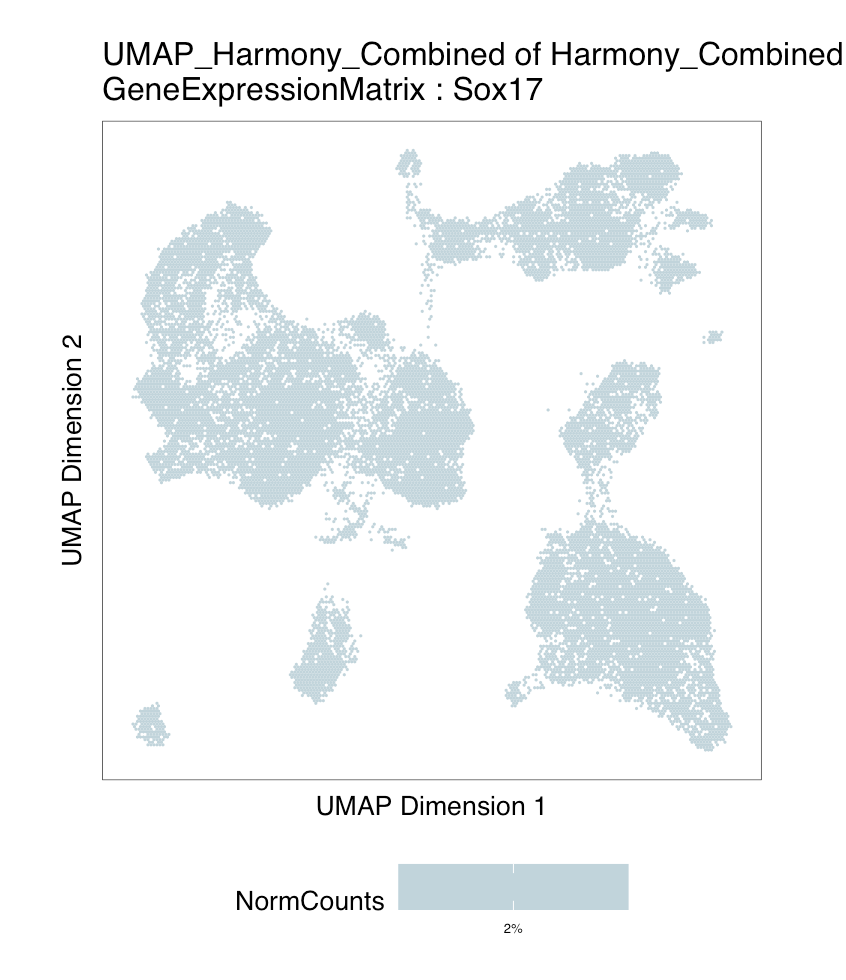
It seems that the genes that don't work have relatively few non-zero entries in the gene expression matrix, e.g. a few hundred out of 37,000+ cells. Is there a minimum number of non-zero entries required for the plotEmbedding function to work? Or do you think something else might be causing the issue here?
ArchR-plotEmbedding-43a34d14939b-Date-2022-06-05_Time-11-49-04.log