RFE: Line numbers for the trace view #96
Description
(Sorry for the delay in getting this as an issue, got sidetracked with the million other things to do. I added/expanded some ideas while I was at it. Ping @laksono @jmellorcrummey)
Currently, the trace view has no way to distinguish between repeated calls to a function on different source lines, which may have vastly different costs and code paths despite following the same function calls. While a Structfile can assist when loops are present, if there are no loops or if the loops are inside function calls Structfiles are ineffective.
Example (simplified) use case: the following code snippet
#include <time.h>
#include <stdio.h>
#include <stdbool.h>
void foo(bool fast_mode) {
  struct timespec ts = {fast_mode ? 1 : 4, 0};
  while(nanosleep(&ts, &ts));
}
int main() {
  foo(true);  // Takes 1 second
  struct timespec ts = {0, 2000000};
  while(nanosleep(&ts, &ts));
  foo(false);  // Takes 4 seconds
  return 0;
}
can/will generate a trace such as the following (fr-line-numbers-for-trace.zip):
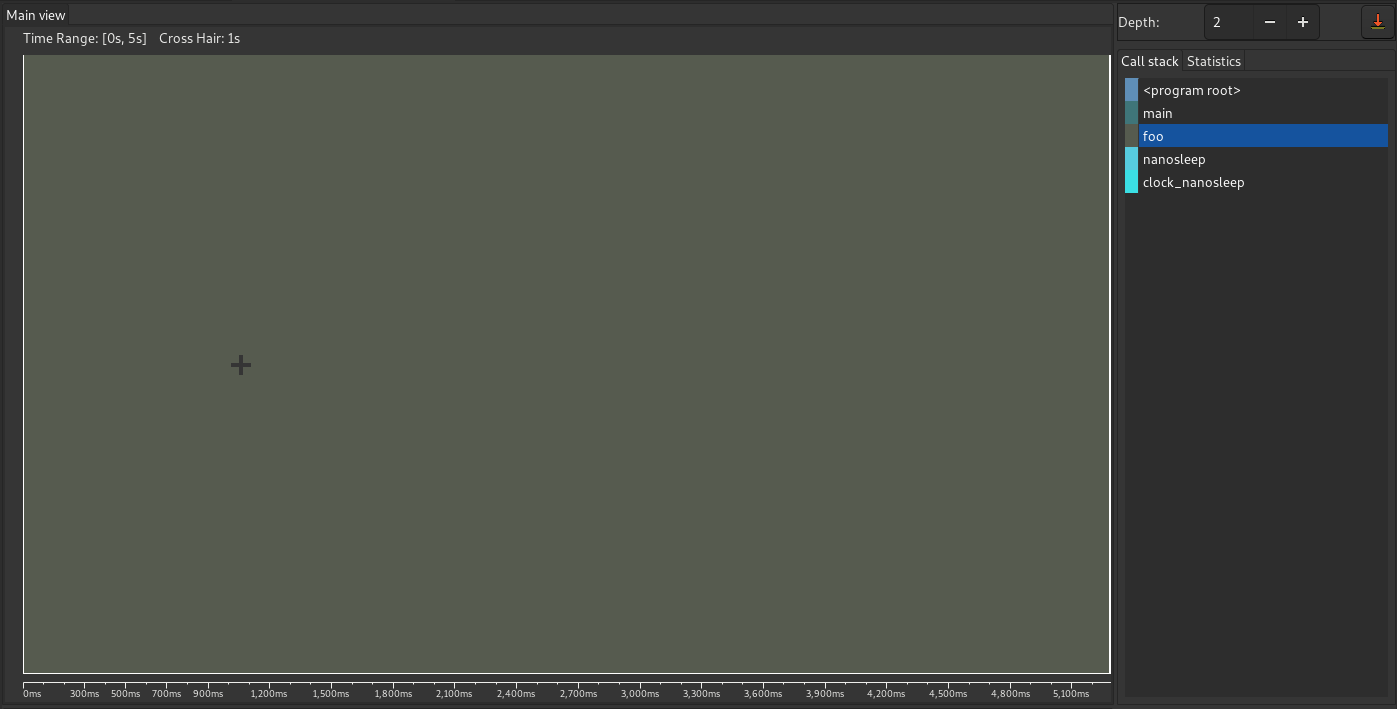
While there is a call to main -> nanosleep (marked with the cursor), its "swallowed up" by the comparatively more expensive calls to foo around it and may not even be sampled if small enough. For cases with more calls to foo with different parameters, this is unacceptably difficult to identify which call specifically is the one in need of adjustment.
The proposed solution is to add line numbers to the "call stack" pane, both to the left of the procedures and in the tooltip. Mock up:
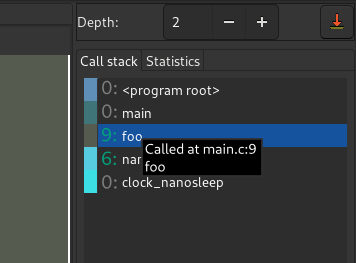
The line numbers should match the colors and meanings used in the profile tab, and clicking a line number should jump to that location in the source pane. Clicking the procedure name should change the depth as it does now since the color swatches are too small a target for that role. (@jmellorcrummey suggested the above should be off by default, I don't see a reason to do so since it matches the profile tab's UI, does not remove or muddle functionality and only spends ~10-15 pixels of user-adjustable horizontal space).
To make room for the source pane, the "profile" and "trace" tab row should be moved to the bottom of the interface. Alternatively, the "trace" tab could be placed inline with the "top-down," "bottom-up" and "flat" view tabs. In this case selecting it only changes the bottom half of the interface, and some sort of easy toggle should be added to hide the source pane for full-screen trace viewing.
The statistics pane should not break functions into lines by default, that would create too many entries and muddle the results.
One option is to add a per-function toggle for whether to break it into lines or not, mock up:
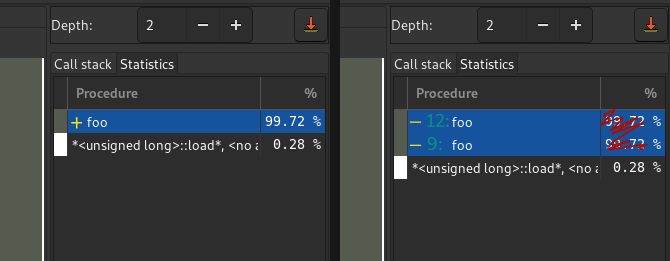
Clicking the icon (drop down menu also an option) switches between function-level (left) and line-level (right) views. Entries with multiple functions (grouped together by explicit color mappings) should always be function-level.
Sufficiently large function-bars in the trace view (both horizontally and vertically) should be inset with a secondary "mini-trace" for source lines, mock up:
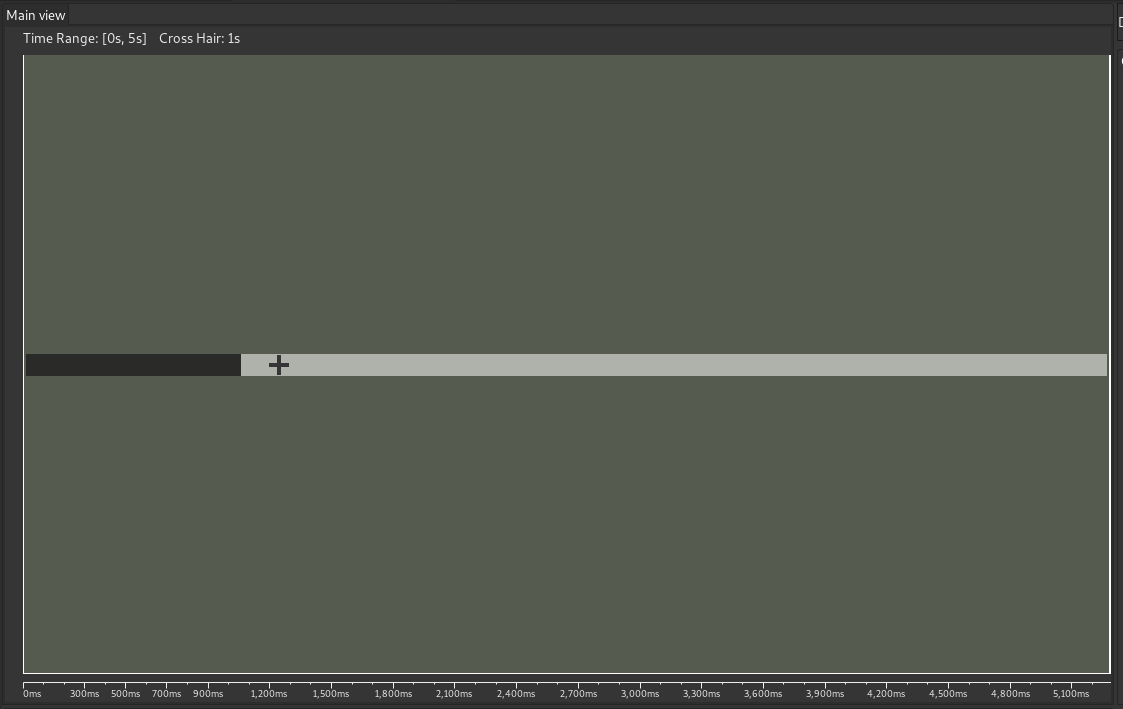
This inset trace should only be rendered if the function bar is sufficiently large to maintain a border around the inset (e.g. 2-5 pixels horizontal, 10-20 pixels vertical) and have a fixed maximum height (e.g. 22-30 pixels) slightly taller than the cursor. The colors should be contrasting with the same or opposing hue as the function bar (e.g. desaturated and adjusted value). These colors should also be inset into the color swatches in the call stack pane and statistics pane (if line-level view is toggled on).