Student Work Path Aggregation Visualization #56
Description
Create a component that can visualize the way in which students work through problems in a tutor. There is already code that does this for an algebra tutor:
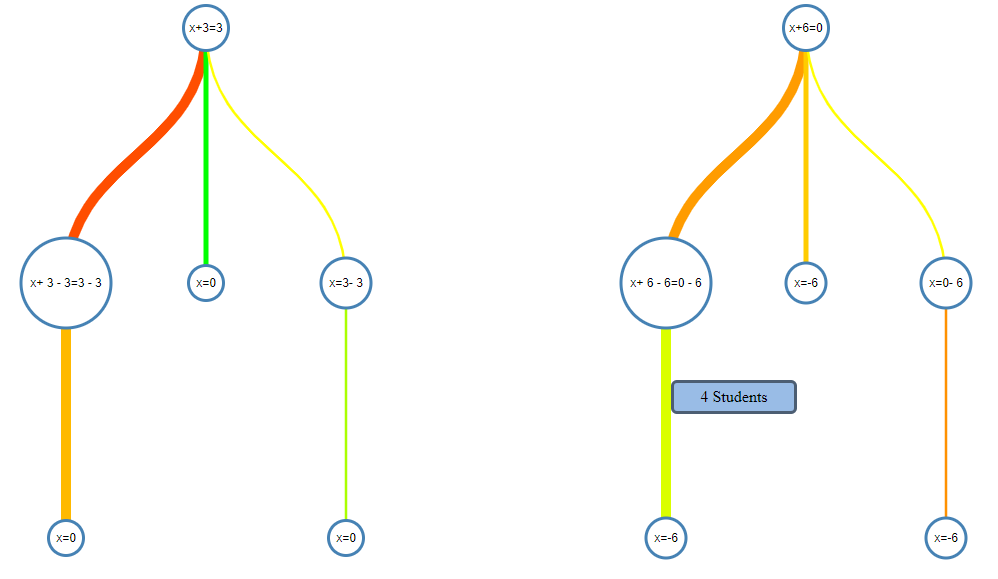
This proposed component would be more general than the above example though. It could take a DataShop transaction export and visualize the paths taken by students. Each node would be a Step. The thickness of the link would be proportional to the number of students that took that path, and the color of the link would indicate the percent correct of the responses students gave on their way from one step to the next.