Interpolation options for spectrograms #146
Description
In IDL SPEDAS, we have interpolation options for spectrogram figures:
no_interp: if set to 0, interpolates along the x, and y axes
x_no_interp: if set to 0, interpolates along the x-axis
y_no_interp: if set to 0, interpolates along the y-axis
Is it possible to add something like this to pyTplot?
Here are some examples from IDL:
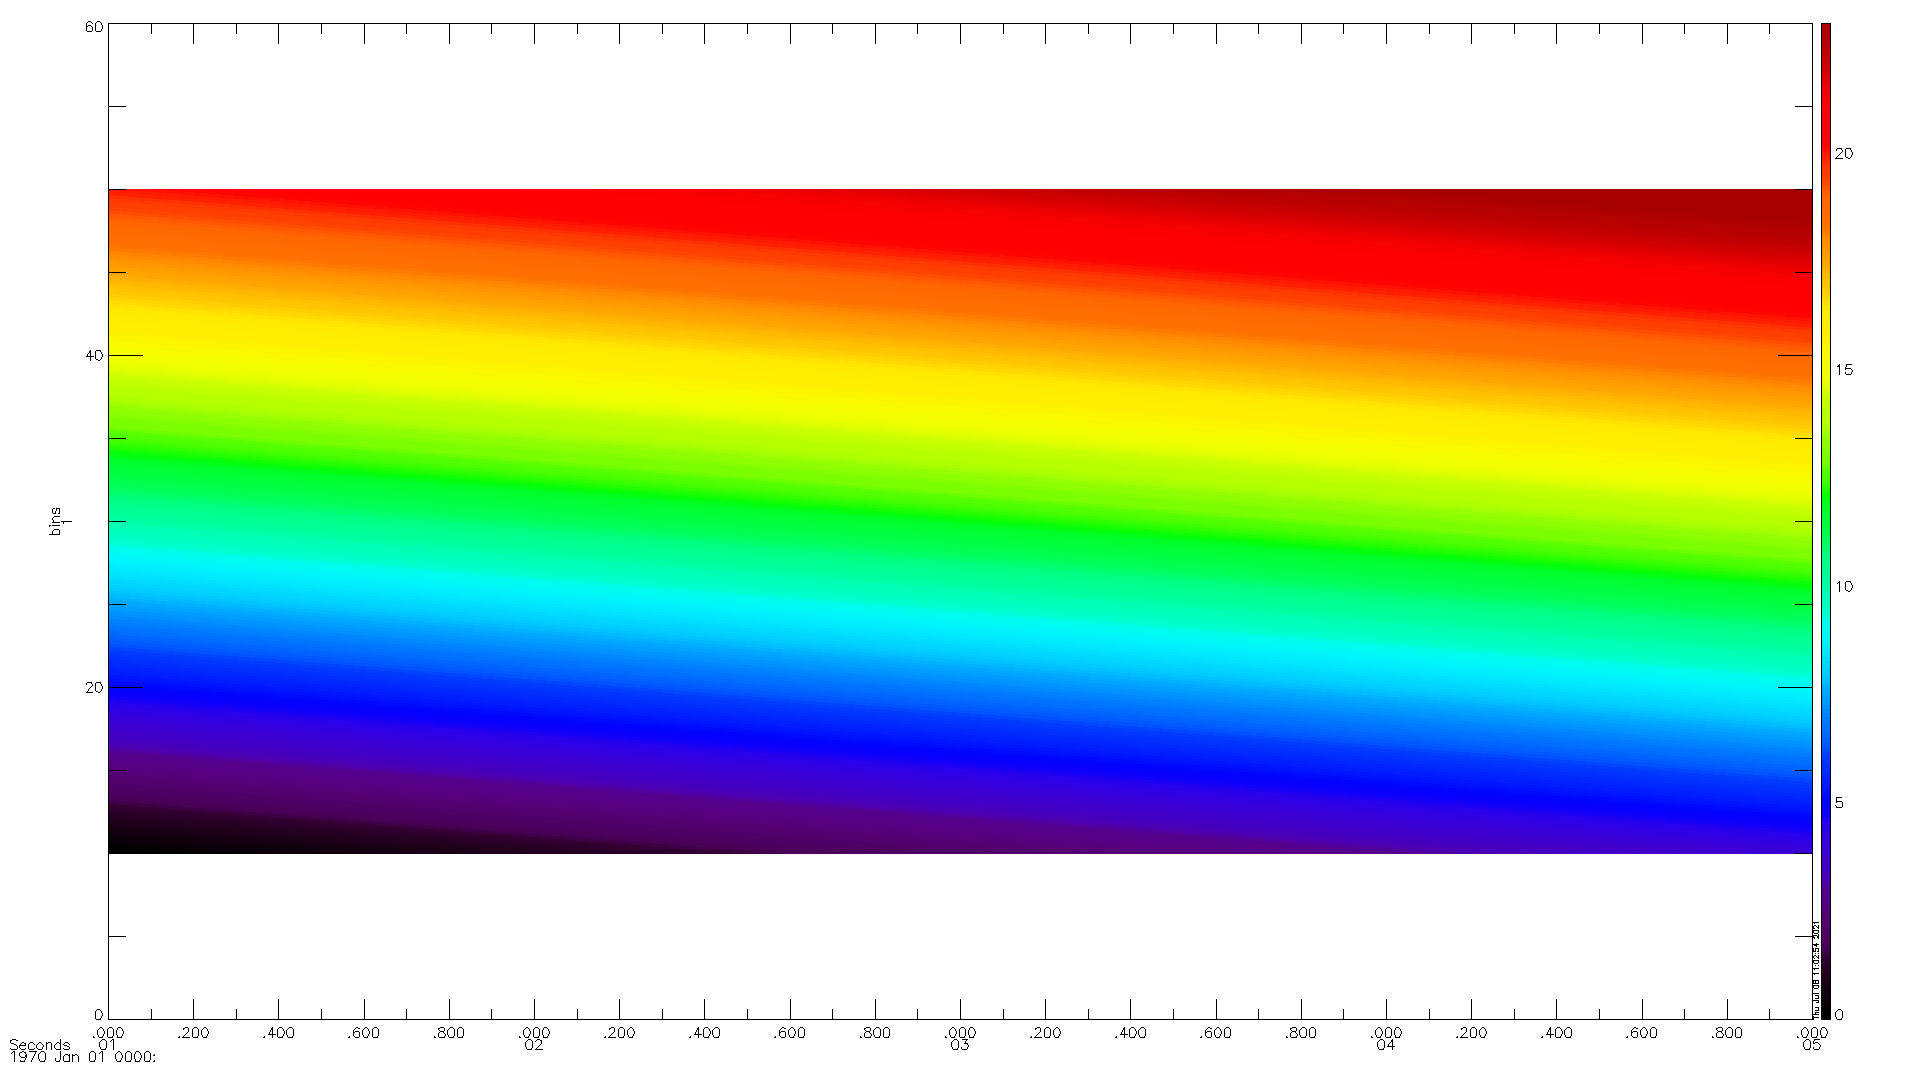
(1) Normal figure
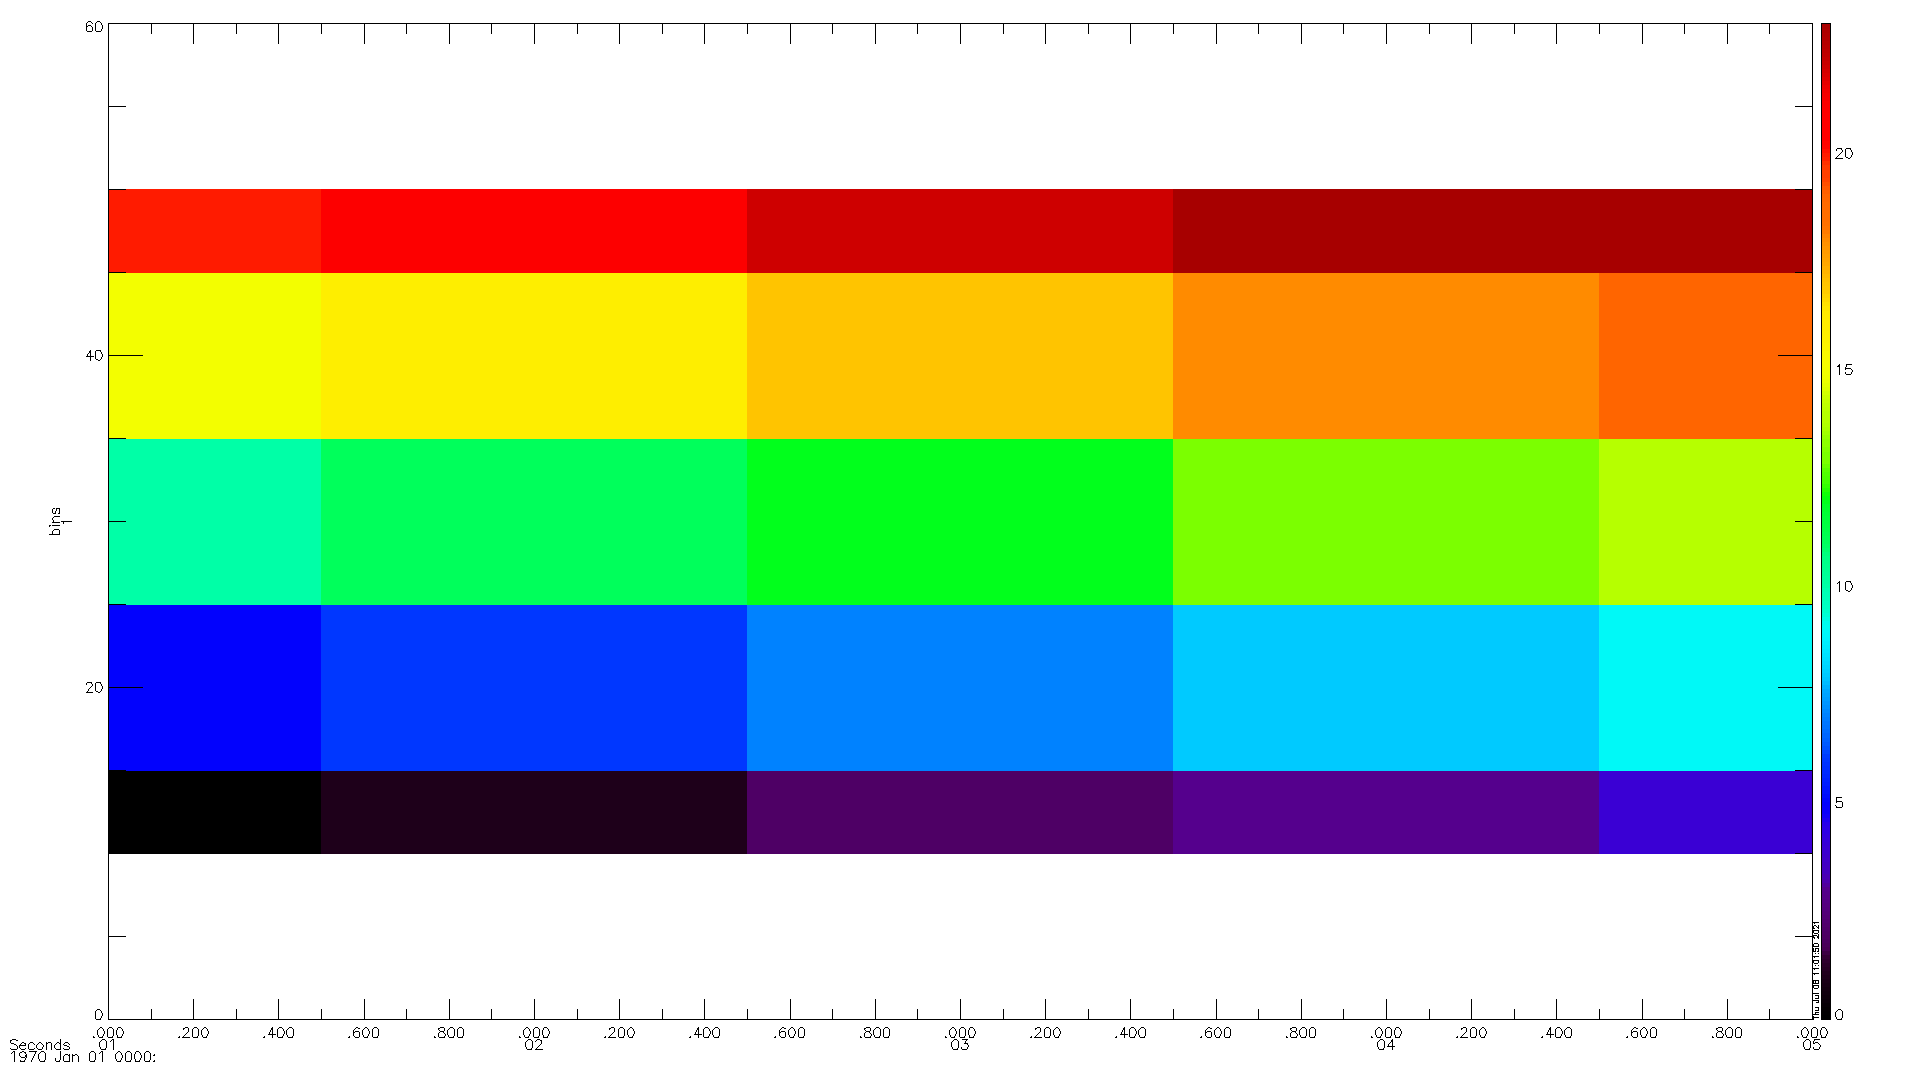
(2) y_no_interp=0

(3) x_no_interp=0
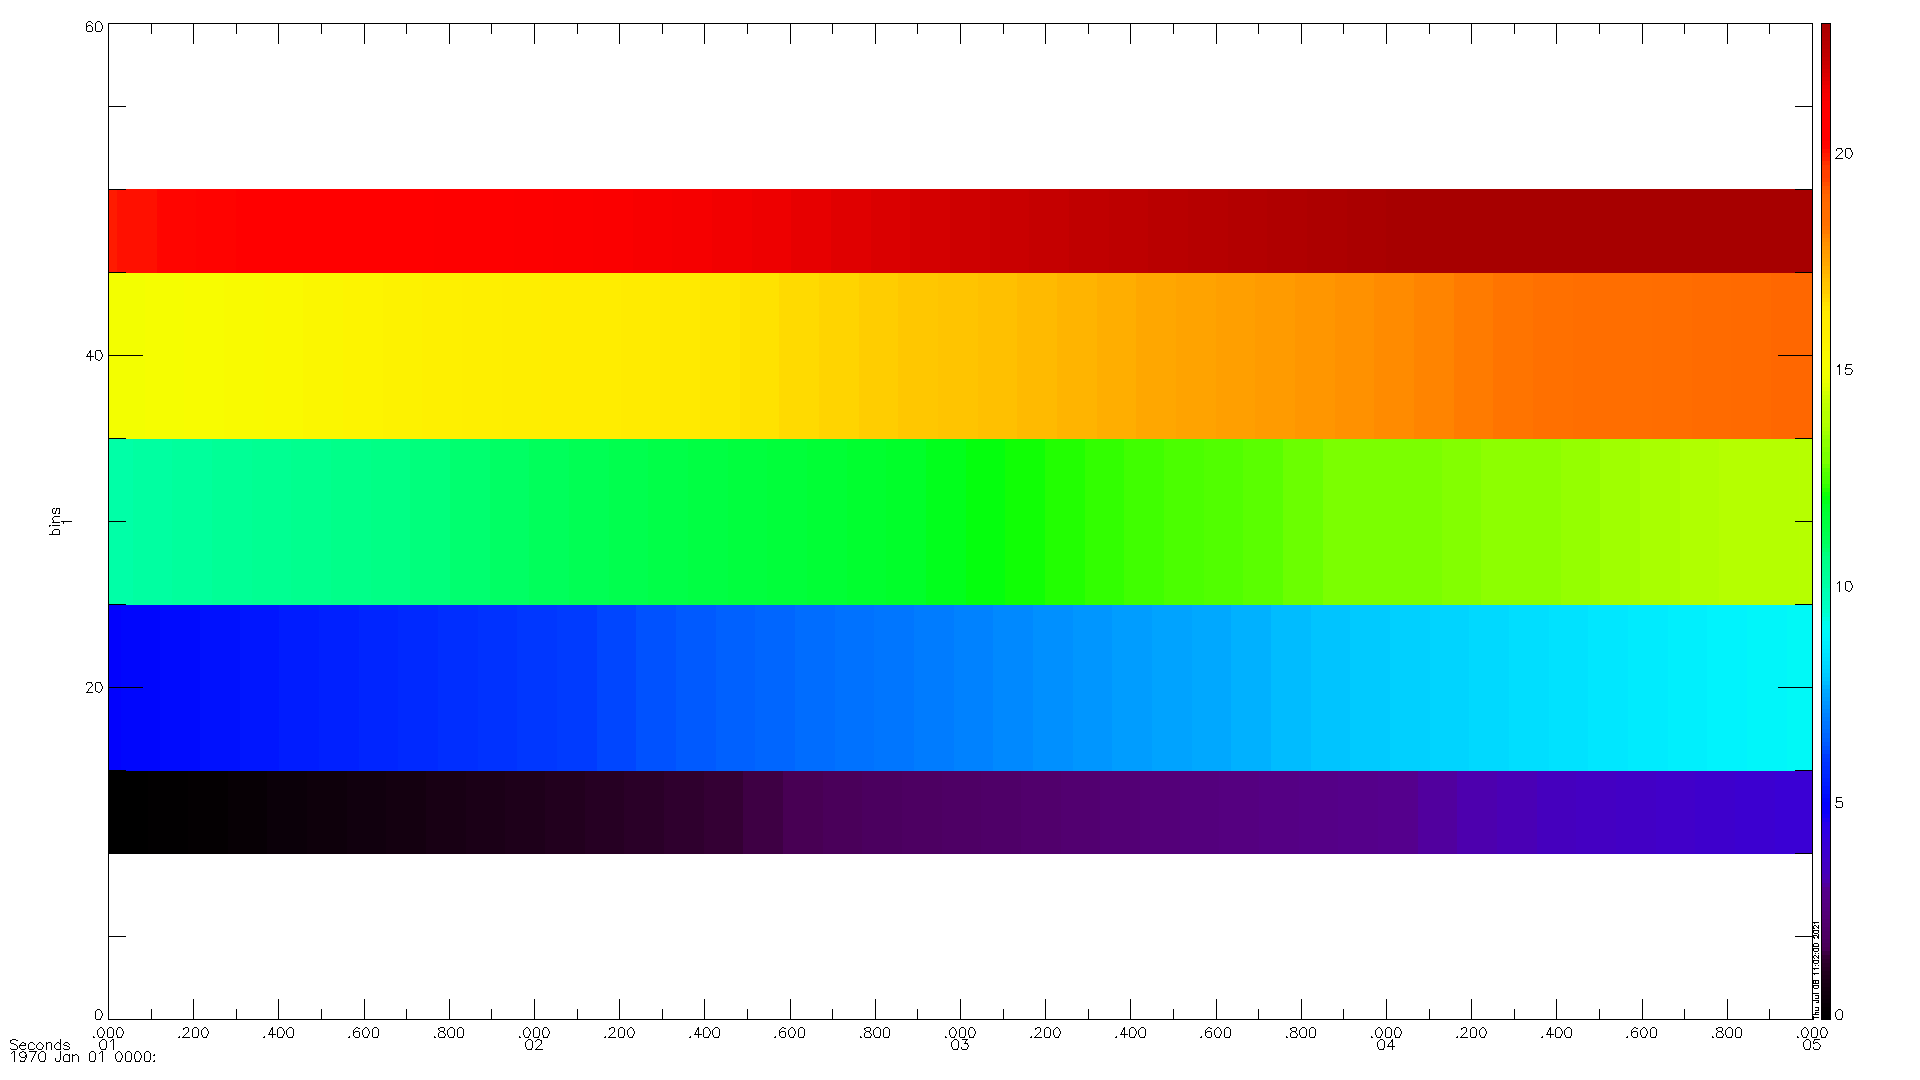
(4) no_interp=0