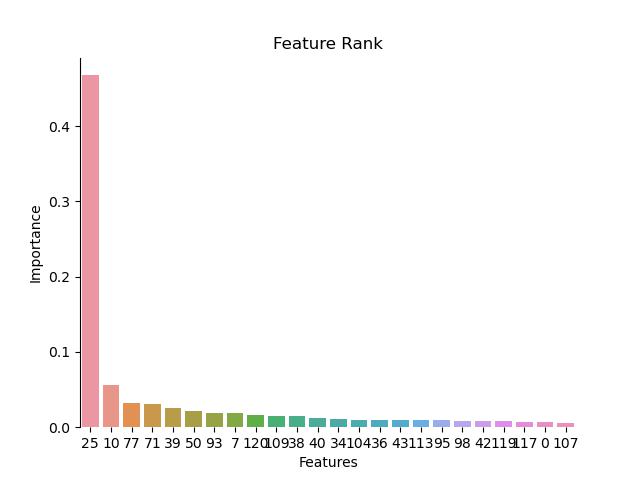
The figure illustrated the feature importance of each substructure in the corresponding compound. The numbers were the value of feature importance
The figure illustrated the feature importance of each substructure in the corresponding compound. The numbers were the value of feature importance

python main.py
- The results in the result folder
. Train R2_Score: 0.9778 Test R2_Score: 0.8546
. Train RMSE: 0.0404     Test MSE: 0.1012
. Train MAE: 0.0247      Test MAE: 0.0665

feature sort:    Features  Importance
25                 25       0.467576
10                 10       0.055683
77                 77       0.031899
71                 71       0.030527
39                 39       0.025558
..                 ...         ...
59                 59       0.000000
3                  3        0.000000
24                 24       0.000000
29                 29       0.000000
35                 35       0.000000

[128 rows x 2 columns]
the top of 30 features is    Features  Importance
0        25    0.467576
1        10    0.055683
2        77    0.031899
3        71    0.030527
4        39    0.025558
5        50    0.022084
6        93    0.019056
7         7    0.018754
8       120    0.015890
9       109    0.015002
10       38    0.014415
11       40    0.012510
12       34    0.011478
13      104    0.010163
14       36    0.010136
15       43    0.009751
16      113    0.009251
17       95    0.009200
18       98    0.007995
19       42    0.007736
20      119    0.007705
21      117    0.006483
22        0    0.006364
23      107    0.005986

the sum of importance is: 0.8312035260103225
- conda create -n env python = 3.7
- conda install scikit-learn
- conda install -c conda-forge rdkit
- pip install seaborn