Products API for the back-end of a clothing retail website that needed to meet the demand of a growing customer base continuosly accessing the over 1,000,000 product inventory. Within two weeks, our team designed a database and server, deployed it on AWS, and achieved a minimum of 1000 responses per second, with less than 1% error rate.
I began the process of architecting a postgres database after analyzing five csv files making up over 26 million rows of data. Once the database was designed to best handle user queries I engineered an ETL process to clean legacy data and ensure seamless loading into PostgresDB using CSV-Parser.
Local Optimizations
Maximizing query efficiency was important to me because I viewed it as a limiting factor for the response time and responses per second goals I was given. Spending more time optimizing query speeds can help save costs when horizontally or vertically scaling. The three main optimizations I made were client pooling, keyset pagination, and indexing.
By using a connection pool, when our user requests can be handled more efficiently. The pool is able to leverage the databases multithreading abilities and reuse threads, rather than creating and tearing down a single thread when using a client connection. This is important when handling many requests per second.
| Before | After |
|---|---|
 |
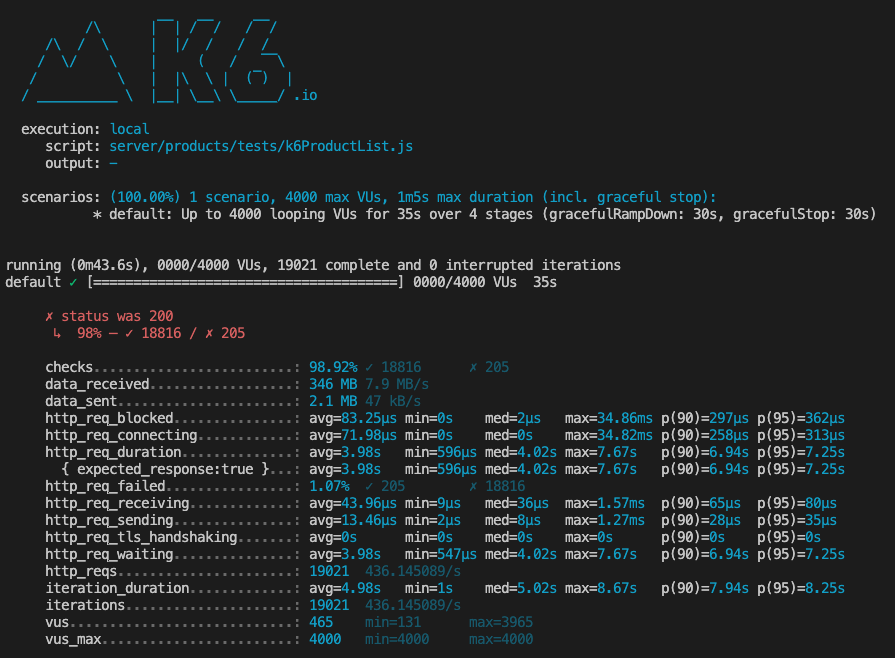 |
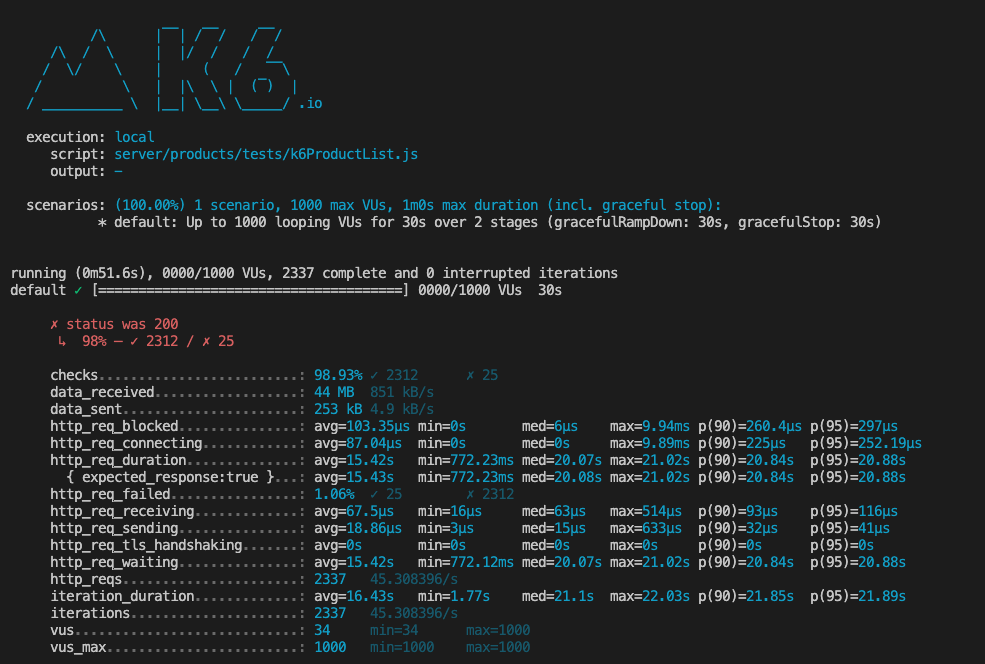
| 1000 RPS Load | 1000 RPS Load |
| Response Time: 15.43s | Response Time: 1.09s |
| Responses per second: 45.31 | Responses per second: 424.44 |
Individual query times using keyset pagination as opposed to OFFSET LIMIT were twice as fast. With a 1000 rps load, response times were 15 times faster and I got nearly ten times the amount of responses per second. This is because the query could go directly to a specific index, rather than sequentially searching through one million products. If we had a smaller database, the difference could be negligible.
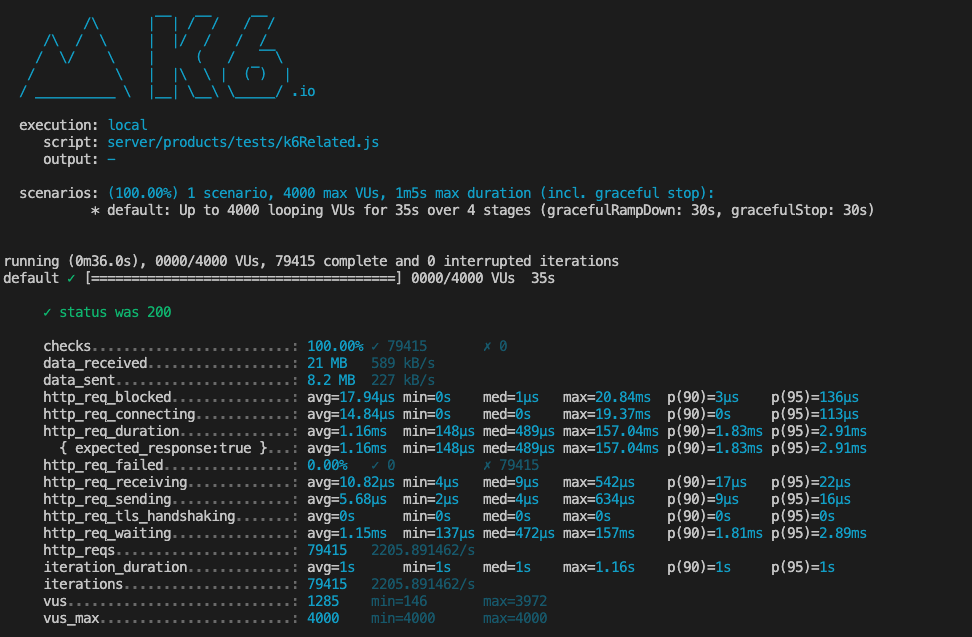
After indexing, individual query times improved significantly, and in one case the query time was reduced from 409.5ms to 23.25ms. That's 17 times faster. In the image below you can see that I was able to achieve a maximum of 2205.89 responses per second with a response time of 1.16ms when ramping up to 4000 responses per second locally.
The back End Architecture consisted of 3 servers, an NGINX load balancer with a cache, and a Postgres database. The products API was then deployed on AWS where load tests were performed via Loader.io.
Deployed Optimizations
The data below is based on the product list API endpoint which returns a specific list of products based on the page and count provided. I will be using the data to show improvements as the backend architecture was scaled, starting with one server and progressing to three serves, a load balancer and caching.
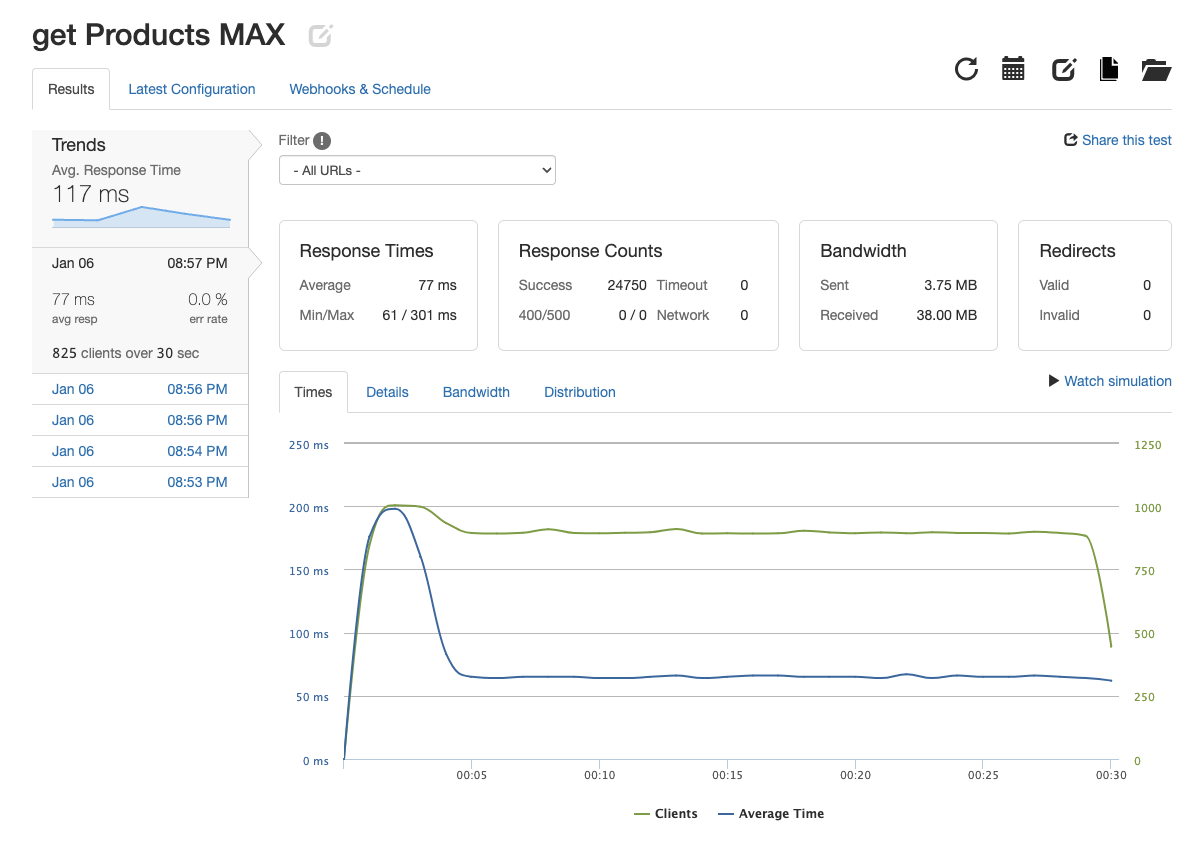
Using Loader.io, I stress tested the system with one server and one database. After 30 seconds of 1000 rps load, a maximum of 931.83 rps was achieved with a 1.479s response time. However, the system performed well under an 825 rps load, easily achieving 825rps at 77ms response time.
I identified that the single server could not handle such a large load, so a second server would be needed. After deploying a second server, NGINX was used to balance the load between the two servers. After 30 seconds of a 1000 rps load, the system achieved 1000 rps with a 65ms response time and 0% error. The goal of 1000 RPS was achieved, but ideally the endpoint would be able to handle a larger number of requests. With the system still limited by only two servers, I added a third server to reach 1796.63 rps with a 73ms response time and 1.4% error rate.
| 2 Servers | 3 Servers |
|---|---|
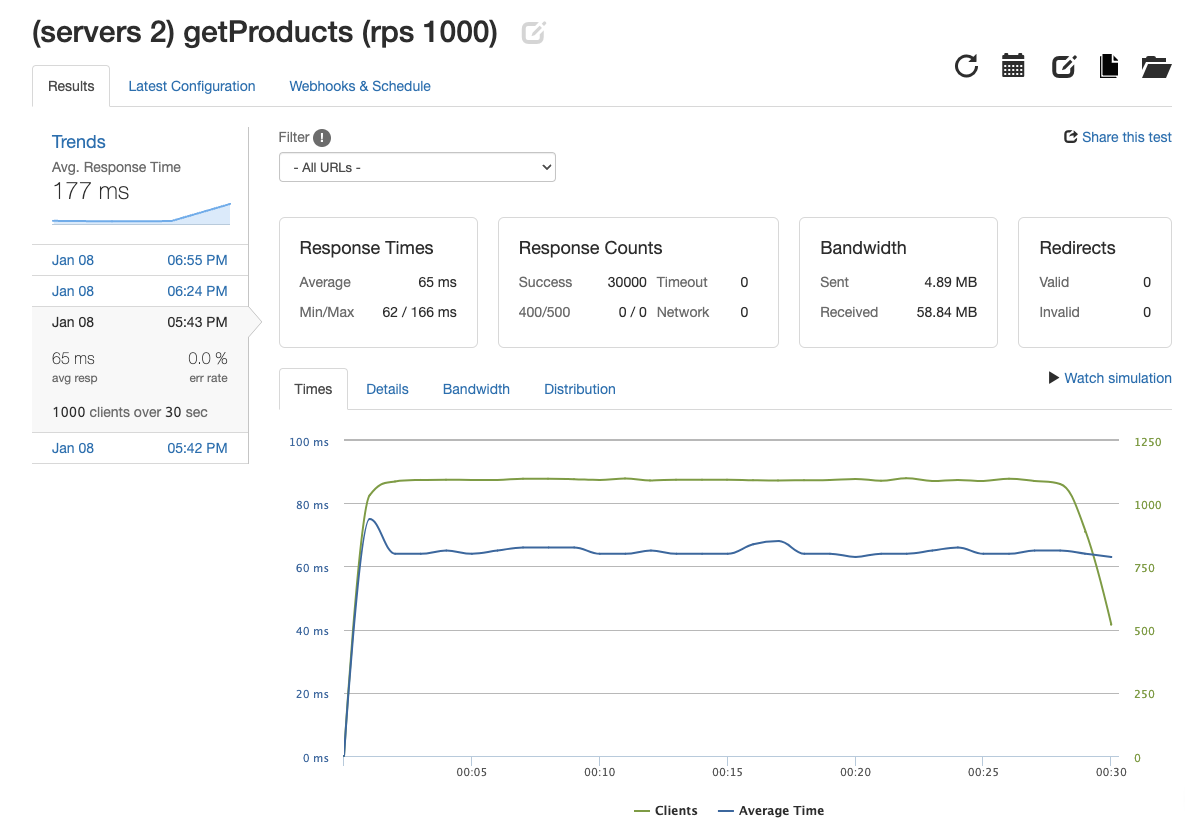 |
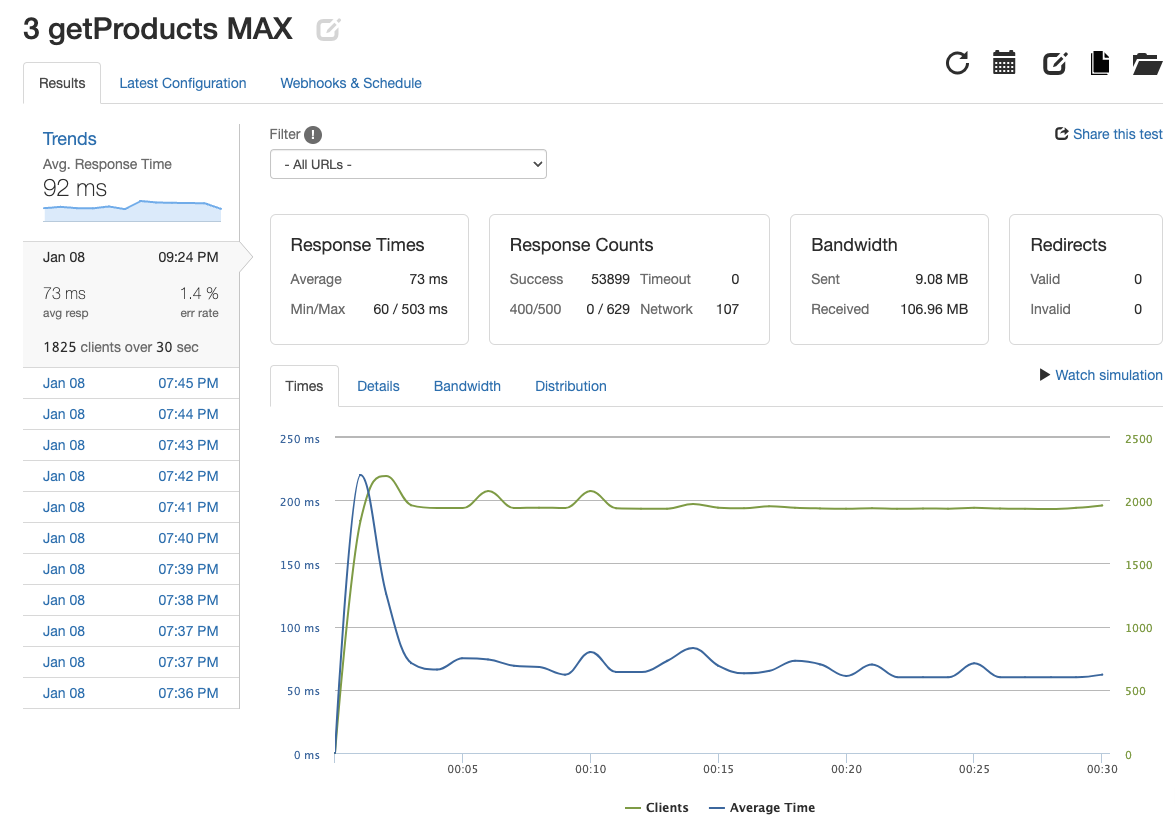 |
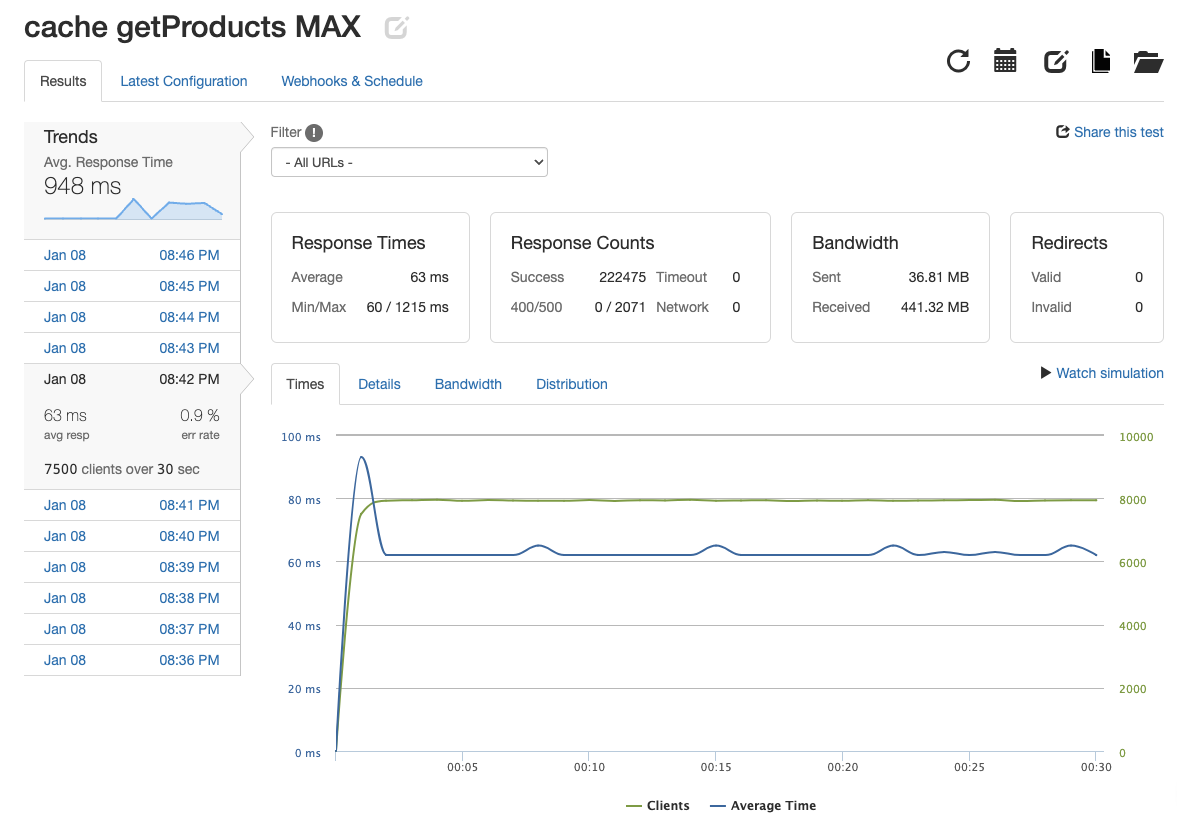
At this point, each endpoint was meeting performance requirements, but the error rate could use an improvement. In order to get the most out of the system and to achieve better performance with increased user traffic I implemented the caching abilities of NGINX. When testing using a load of 1825 rps, the system was able to achieve a respectable 1804.57 rps with a 61 ms response time and 0.9% error rate. This was a significant improvement for each metric. It is important to note that these numbers were achieved after building up the caches memory.
Ultimately, the product list endpoint achieved 4415.83 rps with a response time of 63ms and 0.9% error rate. This was a 790% increase in rps and the response time was 22% faster.
Each API endpoint was able to achieve 3000-7500 responses per second (rps) which was 2000 more than the minimmum expectation of 1000 rps. Balancing the load across 3 servers by using NGINX made these metrics possible. In some cases there was over 100% increase in rps just by horizontally scaling the system from 1 to 3 servers. Response times saw an increase in speed and error rates decreased as well. Finally, NGINX's caching abilites allowed for improvements across the board. Just below the systems maximum rps threshold, the response times were up to 40% faster and error rates fell 77% in some cases. The maximum rps for the system with 3 servers load balanced with caching was 2-4 times greater than the maximum without caching. Below I have created a table to show the metrics for each API endpoint under its max stress.
| API Endpoint | Image | RPS | Response Time | Error Rate |
|---|---|---|---|---|
| get product list |  |
7415.83 | 63ms | 0.9% |
| get product | 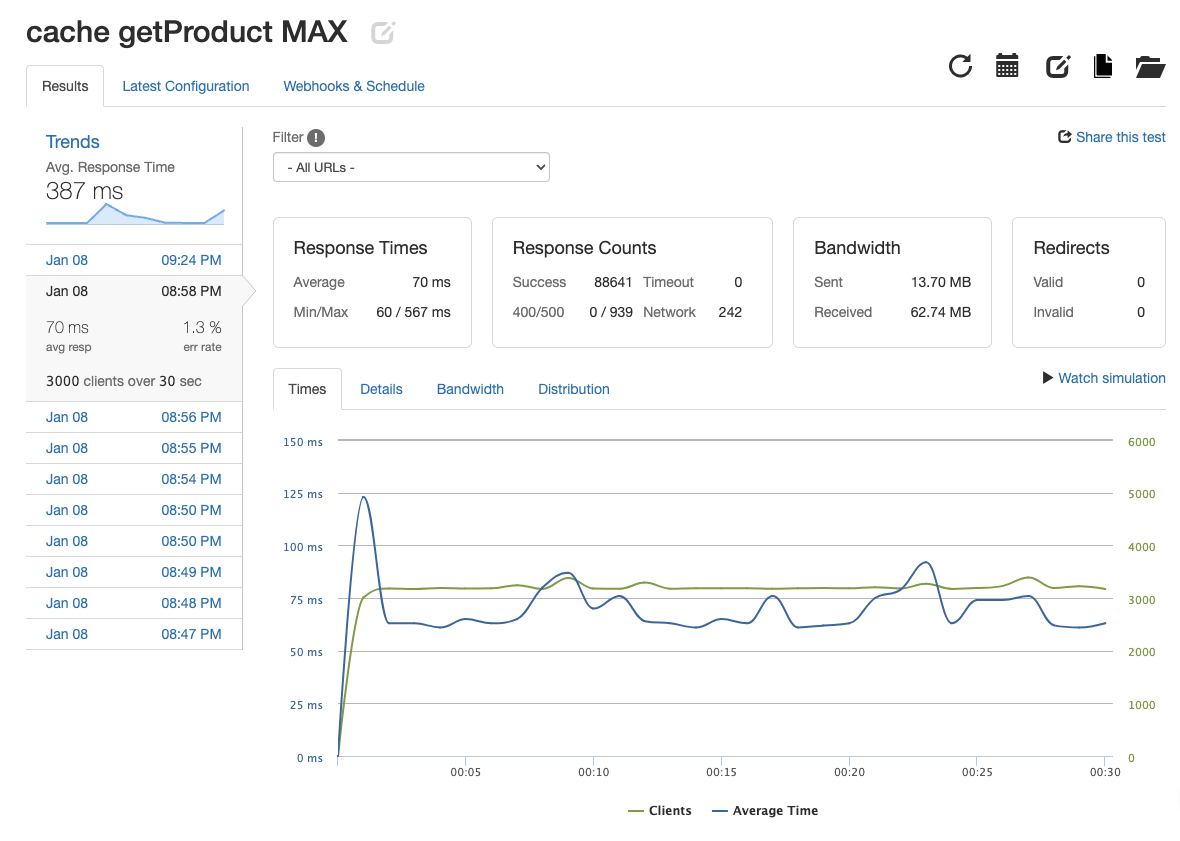 |
2954.7 | 70ms | 1.3% |
| get product styles | 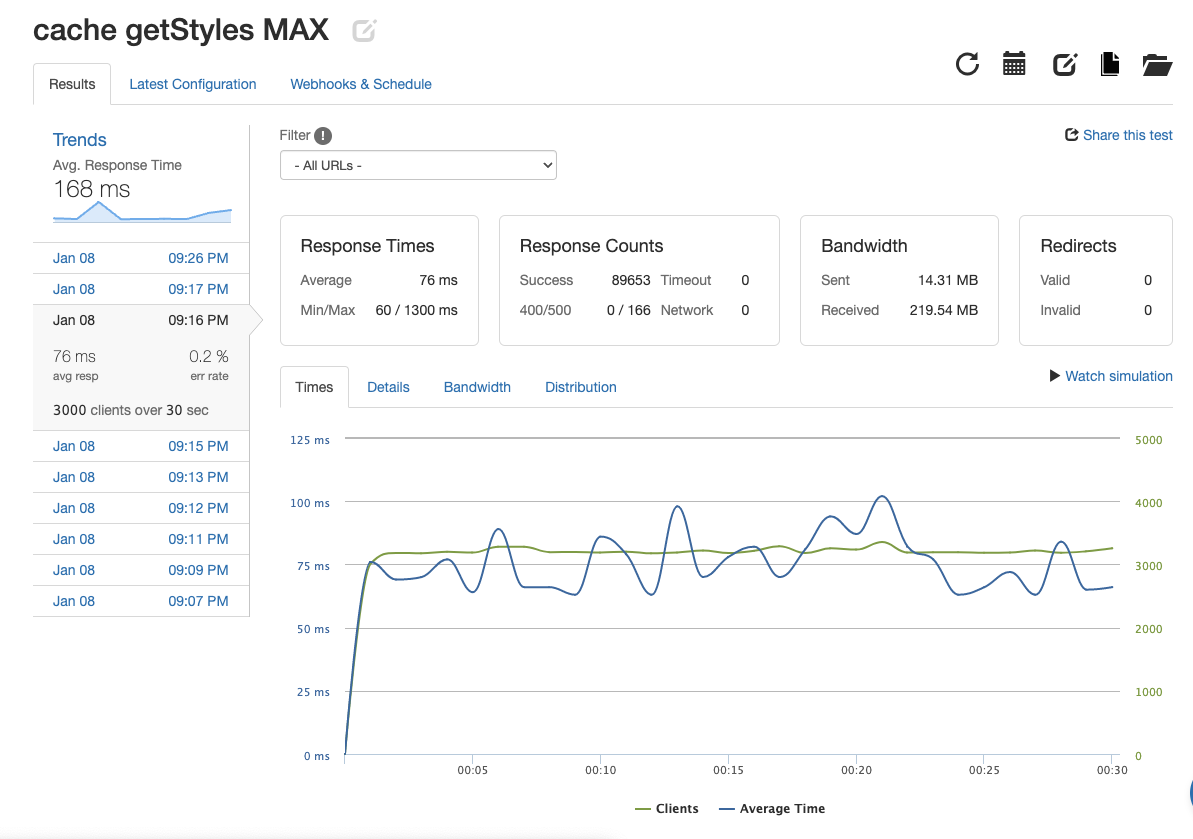 |
2988.43 | 76ms | 0.2% |
| get related products | 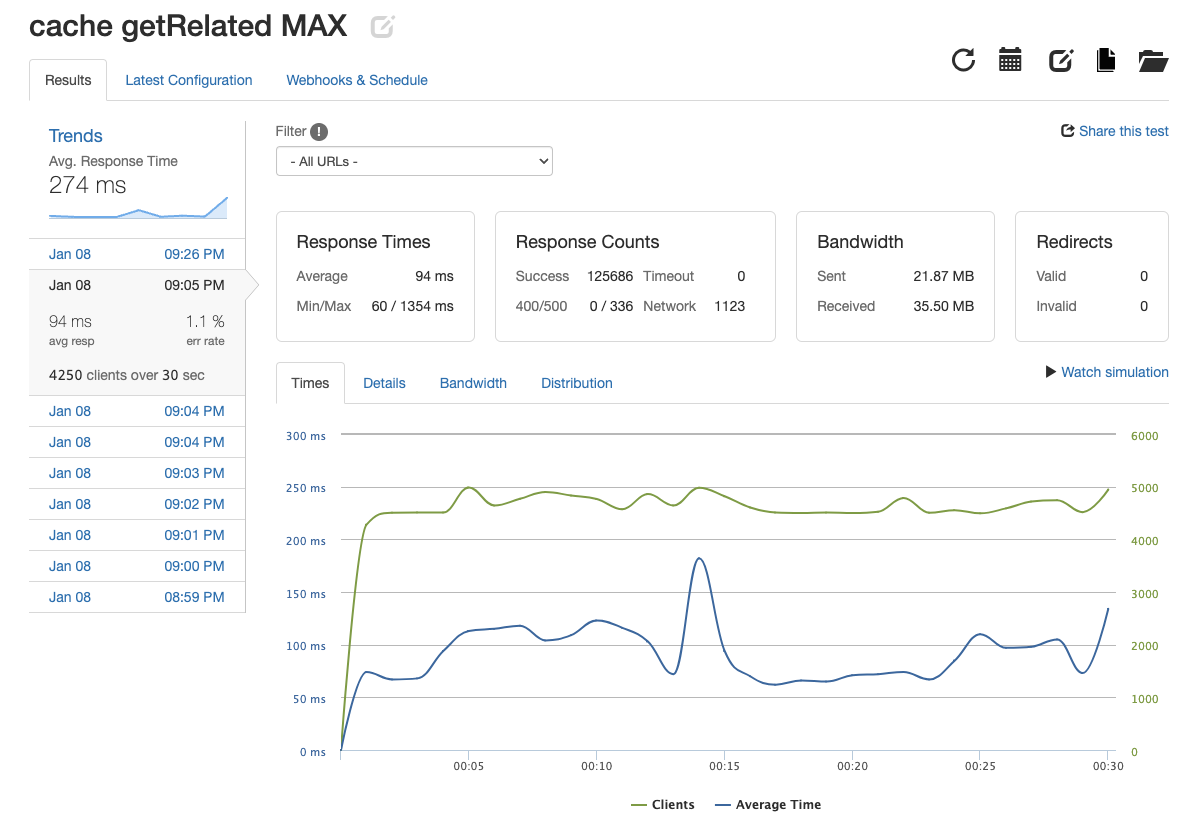 |
4189.53 | 94ms | 1.1% |