I am Pol Juan Santos, student of the Bachelor’s Degree in Video Games by UPC at CITM. This content is generated for the second year’s subject Project 2, under supervision of lecturer Marc Garrigó.
3. Crash dump and Minidump files
4. How to create a dump file in Visual Studio?
5. How to make our own Crash reporter?
We call crash when a computer program such as a videogame, app or any kind fo software stops functioning as normal and exits. This is because the application performs an operation that is not allowed to do. Then, the operating system shuts down the program and triggers a exception or signal indicating what was the reason the crash was produced. Typical causes include incorrect address values in the couter of the program, buffer overflow, accessing invalid memory addresses or attempting to execute machine instructions with bad arguments. In order to fix a crash, the code must be debugged, which is the process of finding and fixing the faulty code which caused the crash so the program can run smoothly again. Then, we should report the crash to get it fixed by the company.


Implementing crash reporting tools as an esencial part of the development cycle has become an obligation,thanks to the commodity that gives. Not only for issues dicovery, but making your workflow easier. That's the case of Sentry, an open-source company, providing an application monitoring platform that helps you identify issues in real-time.Very used in Unreal and an excellent tool.
This notification takes you to a dashboard that gives you the necessary context to quickly triage the problem — frequency, user impact, which part of the code is affected, and which team member is a likely owner for the issue (just like Github issues). Then it shows you detailed information to help you debug, like the stack trace, stack locals, preceding events, commits that likely caused the issue, type of the exception and custom data captured at the time of the error. You can also automatically start tracking the issue in your project management tool. After identifying the problem you commit a fix to the repository. At this point, you no longer need to on alert about the fix because Sentry watches commits as they go in and automatically resolves the issue when it gets deployed. If the issue returns later, it’s marked as a regression and you’re notified again.
Meanwhile, the user who encountered the error didn’t even need to send you a message to help you fix the bug. Notably, though, Sentry can also offer those users a friendly way to send additional information that might help you resolve the issue even faster.


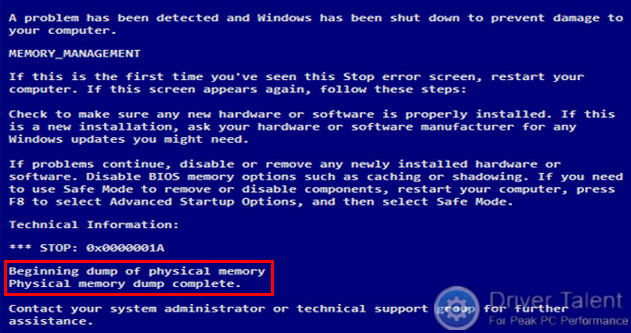
Blackbox records all vital information so when the application crash, you can easily find the reason, in this case:
- Error type
- Callstack
- Register Contents
- General system info(CPU,memory,OS,etc)
- The runtime stack of each thread that was active during the time of the crash. This allows yout to reconstruct stack traces for all stacks and even infer variable values in some cases.
- Thread contexts – that is, register values – at the time of the crash. This is especially relevant for stack walking.
- The crash reason and an optional memory address associated to with the crash. For example, memory access violations. In the case of assertions, the assertion message is also included in the dump.
- Meta data about the CPU architecture and the user’s operating system.
MiniDump files may or may not have heap information.
- Dump files with heaps contain a snapshot of the app's memory, including the values of variables, at the time of the dump.
- Dump files without heaps are much smaller than dumps with heaps, but the debugger must load the app binaries to find symbol information. The loaded binaries must exactly match the ones running during dump creation. Dump files without heaps save the values of stack variables only.

- While stopped at an error or breakpoint during debugging, select Debug > Save Dump As.
- In the Save Dump As dialog box, under Save as type, select Minidump or Minidump with Heap (the default).
- Browse to a path and select a name for the dump file, and then select Save.

- In Visual Studio, select File > Open > File.
- In the Open File dialog box, locate and select the dump file. It will usually have a .dmp extension. Select OK.

