Added the ability for plot to put the cube data on the x axis if plotting just a cube against a vertical or y coordinate.#2901
Conversation
|
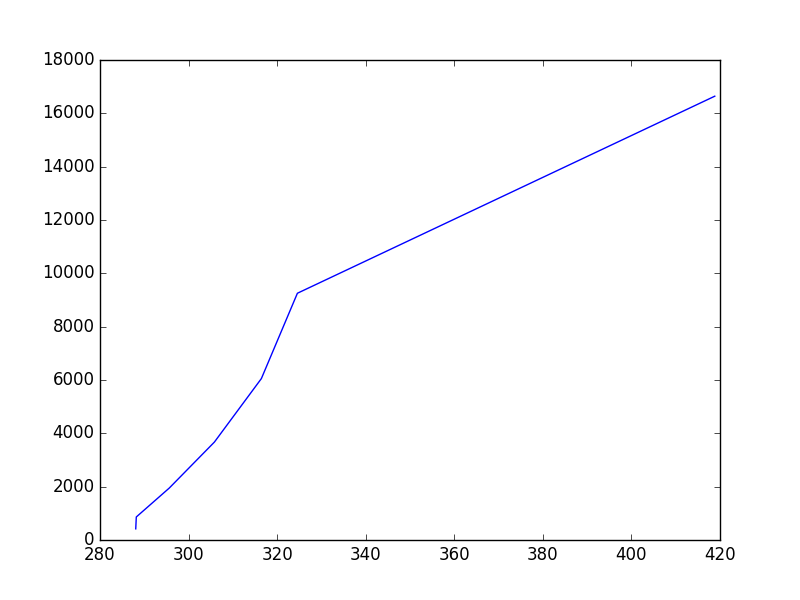
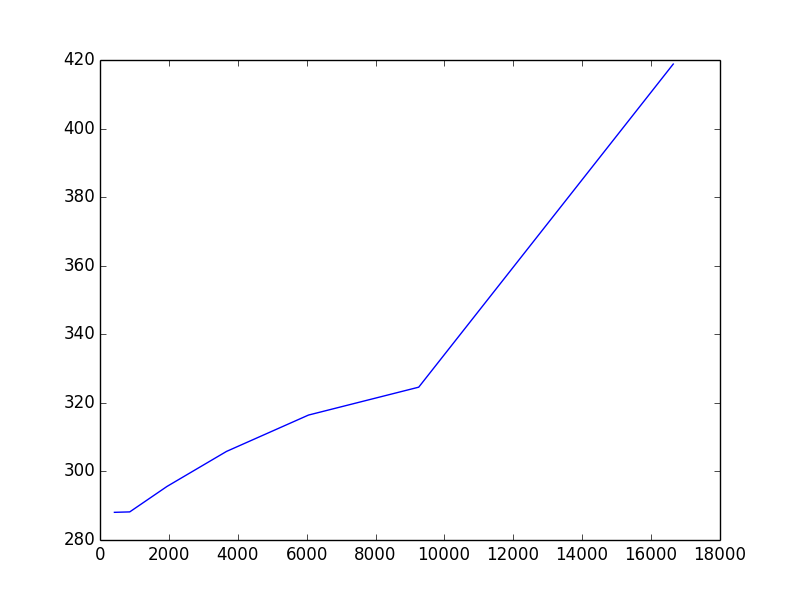
Looks like a genuine failure. Old test: https://scitools.github.io/test-iris-imagehash/images/f15f832a5ee0492a36e8b9ed8fa4f2b629dace4921681e17a9807e7c89835ef0.png New test:
|
a866f7f to
7ed42da
Compare
|
That is an altltude vs temperature plot, the new one is correct for the change you made. |
|
Others are either altitude vs temperature or latitude vs temperature, both of which should be affected by this PR, so all looks good to me. |
lib/iris/plot.py
Outdated
| # is vertical-like, put the coordinate on the y axis, and the data o | ||
| # the x. | ||
| if (isinstance(v_object, iris.cube.Cube) | ||
| and iris.util.guess_coord_axis(u_object) in ['Y', 'Z']): |
There was a problem hiding this comment.
This is your coding standards error, the and should be on the previous line.
lib/iris/quickplot.py
Outdated
| def _label_1d_plot(*args): | ||
| if len(args) > 1 and isinstance(args[1], | ||
| u_obj, v_obj, _, _, _ = iplt._get_plot_objects(args) | ||
| if len(args) > 1 and isinstance(u_obj, |
There was a problem hiding this comment.
If statement is now not needed.
|
Probably a small amount of effort needed to bring this up to speed. |
…otting just a cube against a vertical or y coordinate.
7ed42da to
b1bfb4a
Compare
|
I've rebased and fixed the pep8 issue. I'm unlikely to get the time to do the image hashes soon unfortunately. |
|
Closing as this has gone stale. Implementation is solid if somebody want to take it on and get it over the finishing line. |
Closes #612.
Would need a what's new.