A neat instrument designed for visualizing neural networks.
Experience seamless visualization without the burden of conversion.




🎯 Effortless Visualization
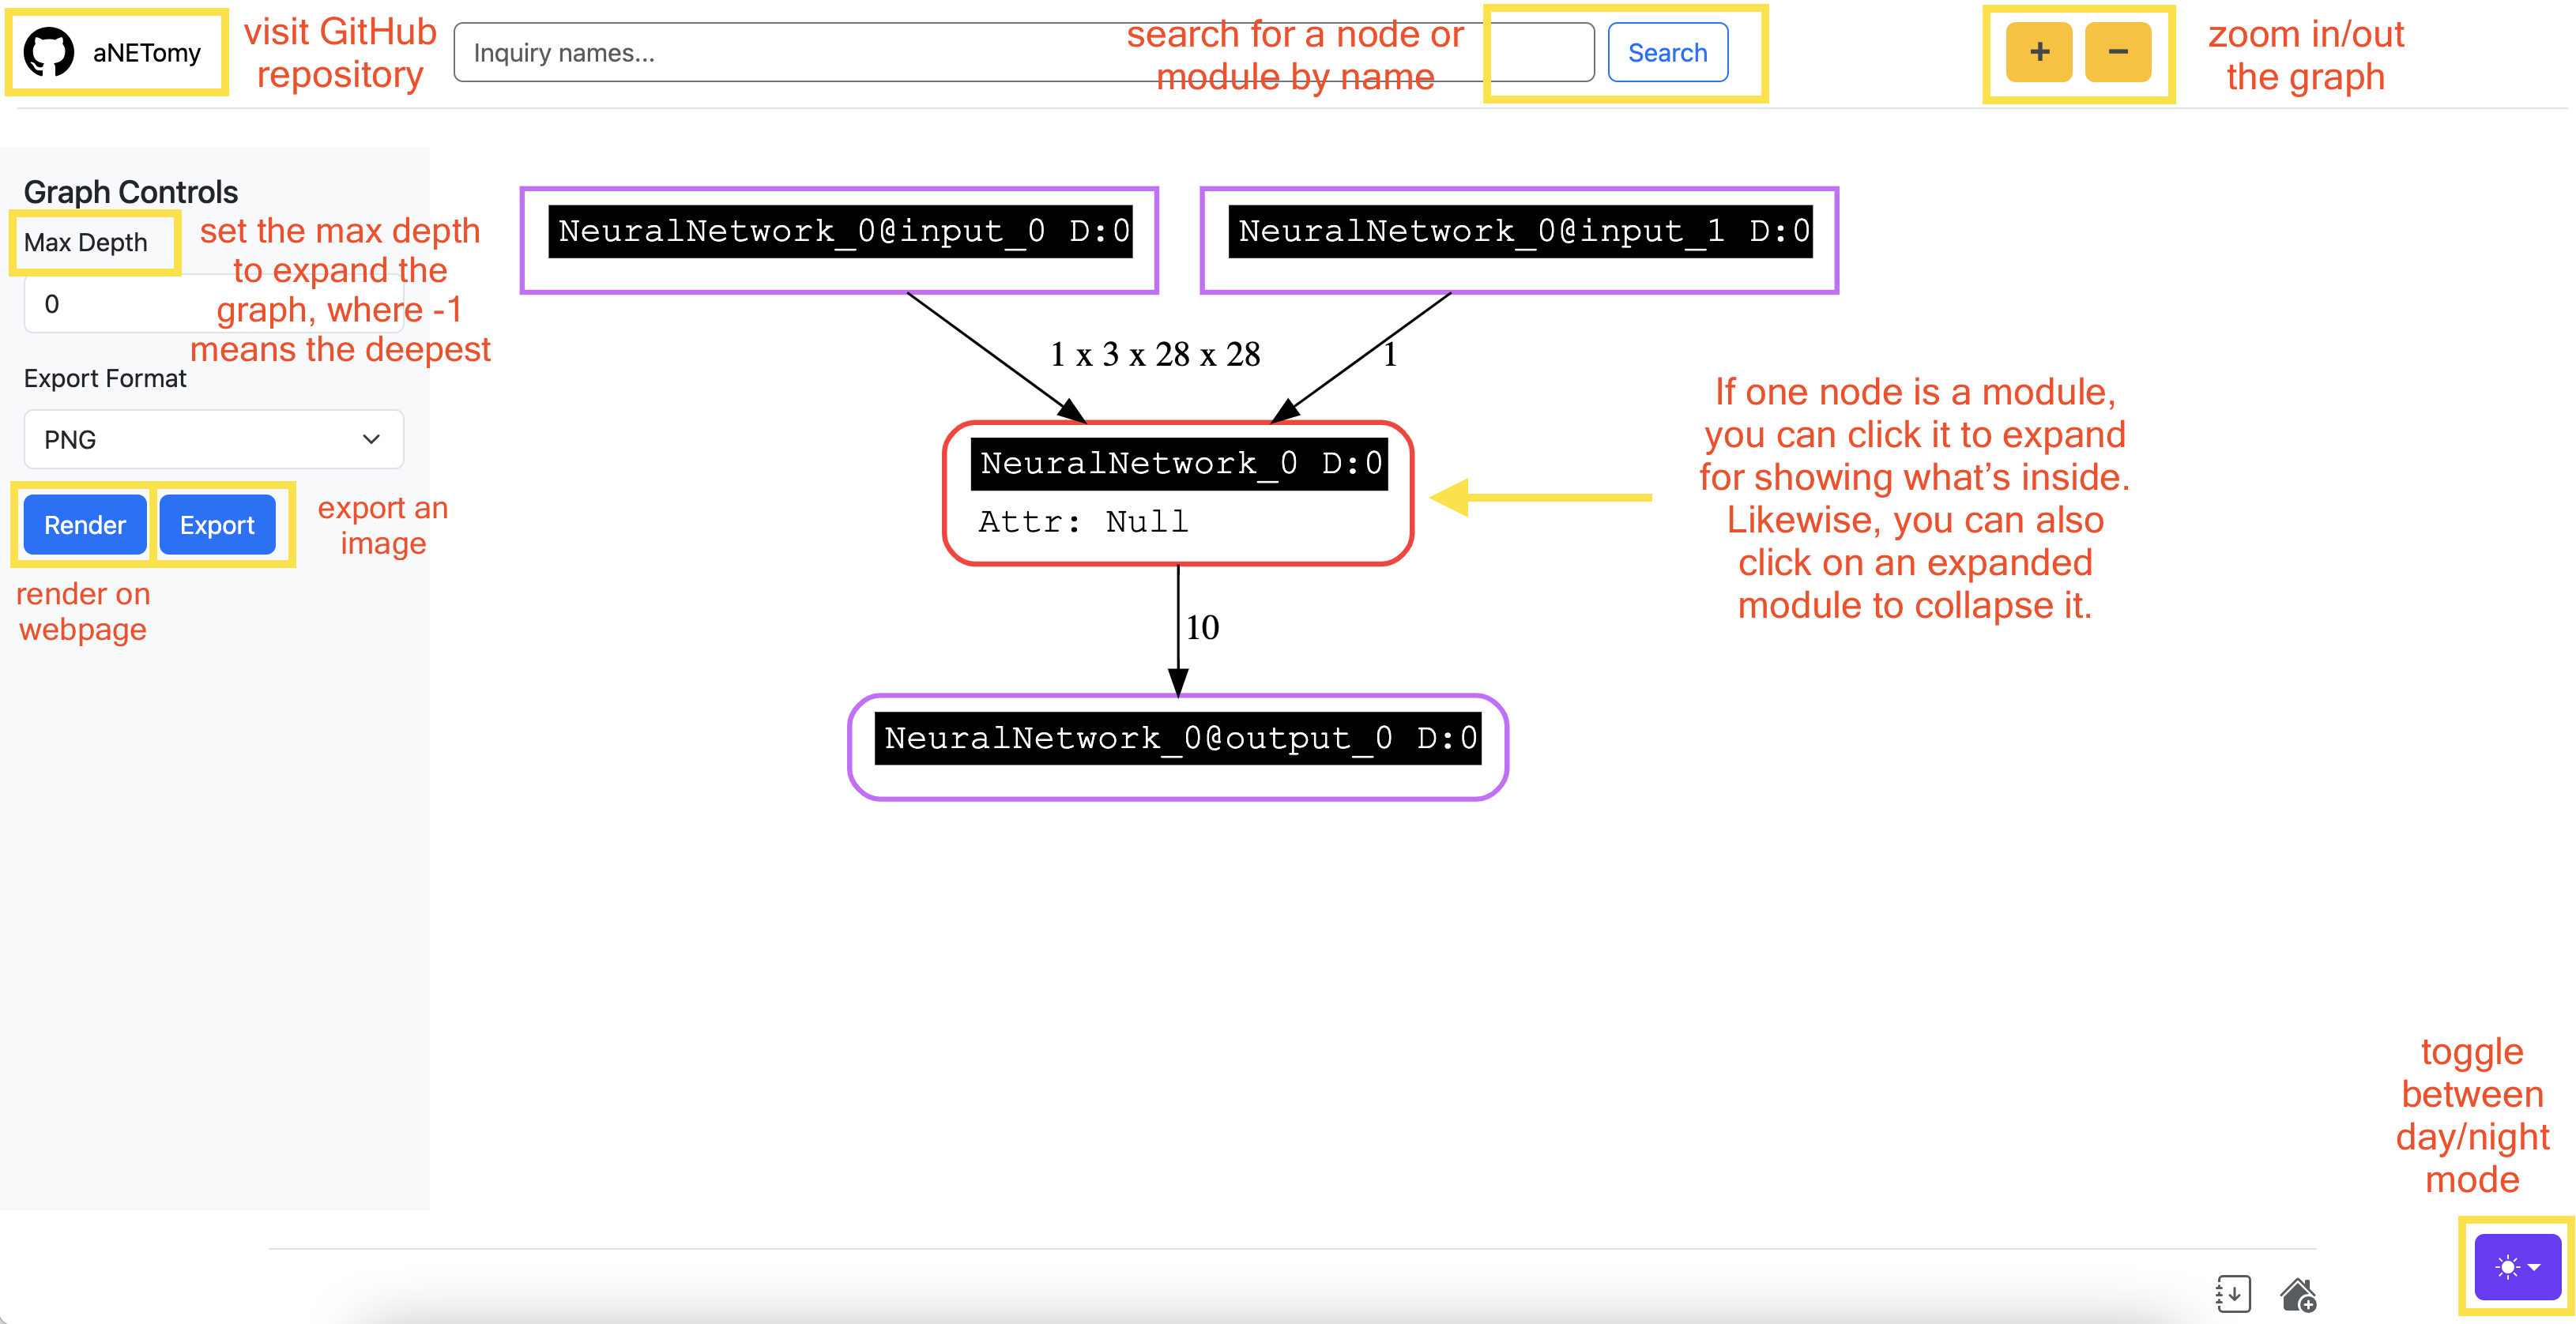
Given that PyTorch is an imperative framework, to visualize on the fly could be very useful for developers. aNETomy sidesteps the prep and conversion while keeping the accessibility and compatibility.
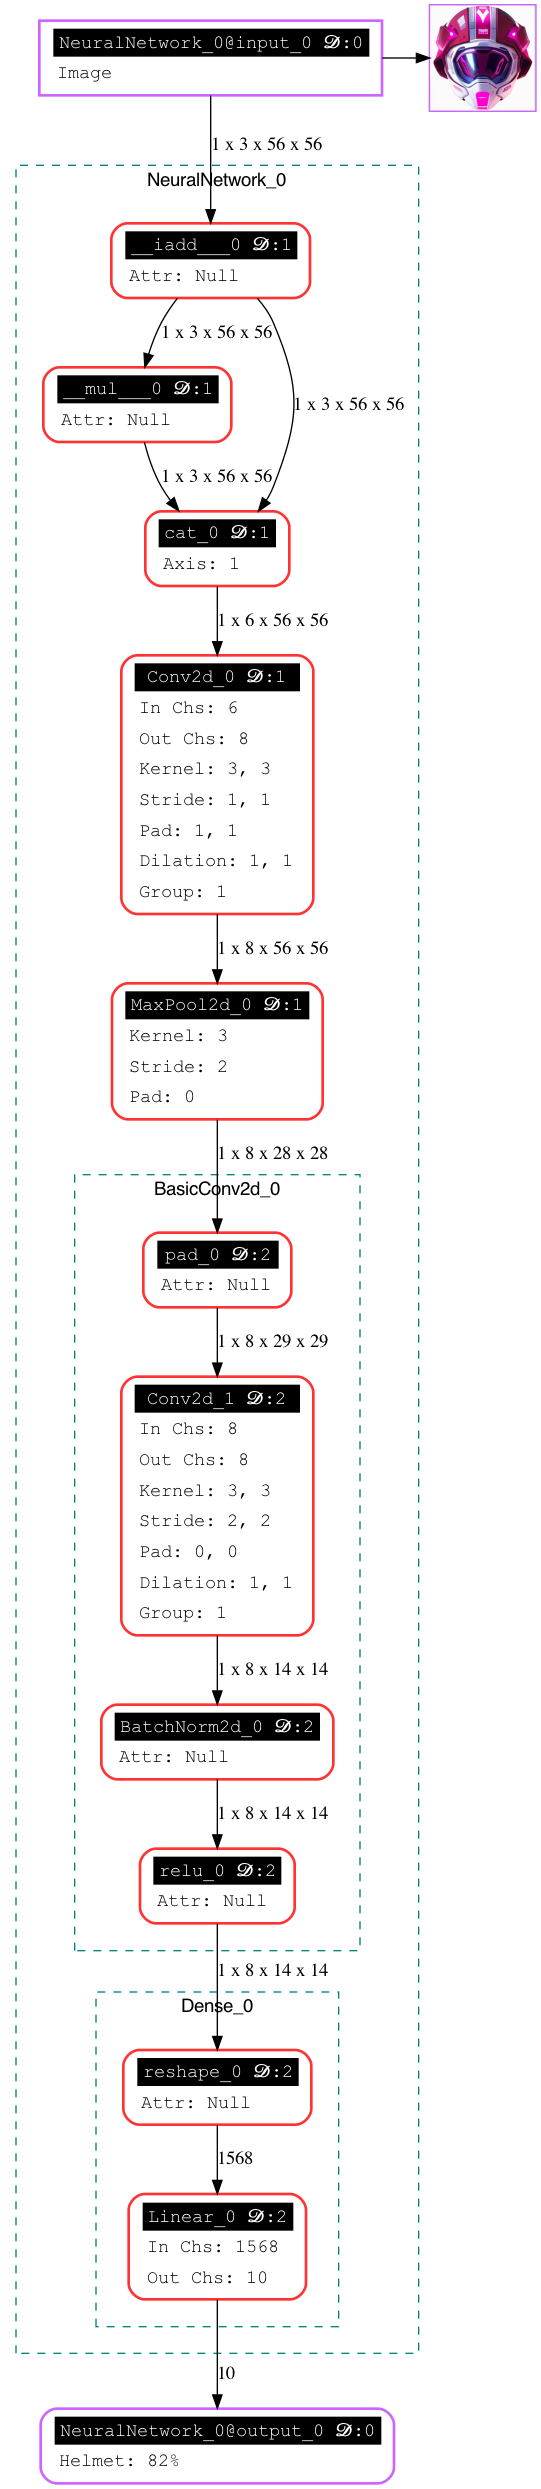
The fully expanded graph looks like below.
The following comparison are concluded according to hands-on practical experience. It could be wrong somewhere.
| Feature | aNETomy | Netron | TensorBoard | torchviz | torchinfo | torchview | torchlens | torchexplorer |
|---|---|---|---|---|---|---|---|---|
| Less Preparation | ✅ | ❌ | ✅ | ✅ | ✅ | ✅ | ✅ | ✅ |
| Handles Dynamic Models | ✅ | ❌ | ❌ | ✅ | ✅ | ❌ | ||
| Interactive Graphs | ✅ | ✅ | ✅ | ❌ | ❌ | ❌ | ❌ | ✅ |
| Tensor Shapes | ✅ | ✅ | ❌ | ✅ | ✅ | ✅ | ✅ | ✅ |
| Structure Completeness | ✅ | ✅ | ✅ | ❌ based on autograd | ✅ | ❌ based on autograd | ||
| Compatibility | ✅ | ✅ | ❌ No | ✅ | ✅ | ✅ |
Add several lines to your python code for visualizing and saving graphs.
import anetomy
import torch
from torch import nn
import torch.nn.functional as F

# define the toy model
class Dense(nn.Module):
    def __init__(self):
        super().__init__()
        self.lin = nn.Linear(28*28*2, 10)

    def forward(self, x):
        x = F.relu(x, inplace=True)
        x = x.reshape(-1,)
        y = self.lin(x)
        return y

class NeuralNetwork(nn.Module):
    def __init__(self):
        super().__init__()
        self.conv1 = nn.Conv2d(3, 8, 3, padding=1)
        self.mpool1 = nn.MaxPool2d(3, stride=2, ceil_mode=True)
        self.dense = Dense()

    def forward(self, x, scale=1):
        x *= scale
        y = self.conv1(x)
        y = self.mpool1(y)
        y = self.dense(y)
        return y

# input dummy data to visualize
net = NeuralNetwork()
dummy_x = torch.randn(1, 3, 28, 28)
dummy_s = 2
anv = anetomy.NetVue(graph_path='./toynn.png')
anv.dissect(net, dummy_x, scale=dummy_s)
# use render() to save network image directly
anv.render(3) # set the max depth to expand as 3
# use launch() to run a web server for inspection
anv.launch('127.0.0.1', port=7880)At first, install graphviz beforehand.
Use Homebrew for a quick installation:
brew install graphvizFor Debian-based systems (Ubuntu, Debian):
sudo apt update && sudo apt install graphvizFor Arch-based systems (Arch, Manjaro):
sudo pacman -S graphvizFor RHEL-based systems (Fedora, CentOS):
sudo dnf install graphvizThen install the bindings.
pip install graphvizFinally, install anetomy via pip.
pip install anetomyIf you find aNETomy helpful, please give it a ⭐ on GitHub!