This project provides a software to plot intensity of images according to differnt color channels. This project is designed for processing medical images.
This executable file requires Matlab runtime R2022b (9.11). Please find the runtime at https://www.mathworks.com/products/compiler/matlab-runtime.html for free.
If you feel this software helps your research, please use the following citation information. Please contact us (yganlab@gmail.com) if you want to access the source code.
APA: Li, X., & Gan, Y. (2023). Calculate intensity of medical images over color-channels (Version 1.0.0) [Computer software]
BibTex: @software{Li_Calculate_intensity_of_2023, author = {Li, Xueshen and Gan, Yu}, month = {1}, title = {{Calculate intensity of medical images over color-channels}}, version = {1.0.0}, year = {2023} }
To use this software, please see the following examples.
-
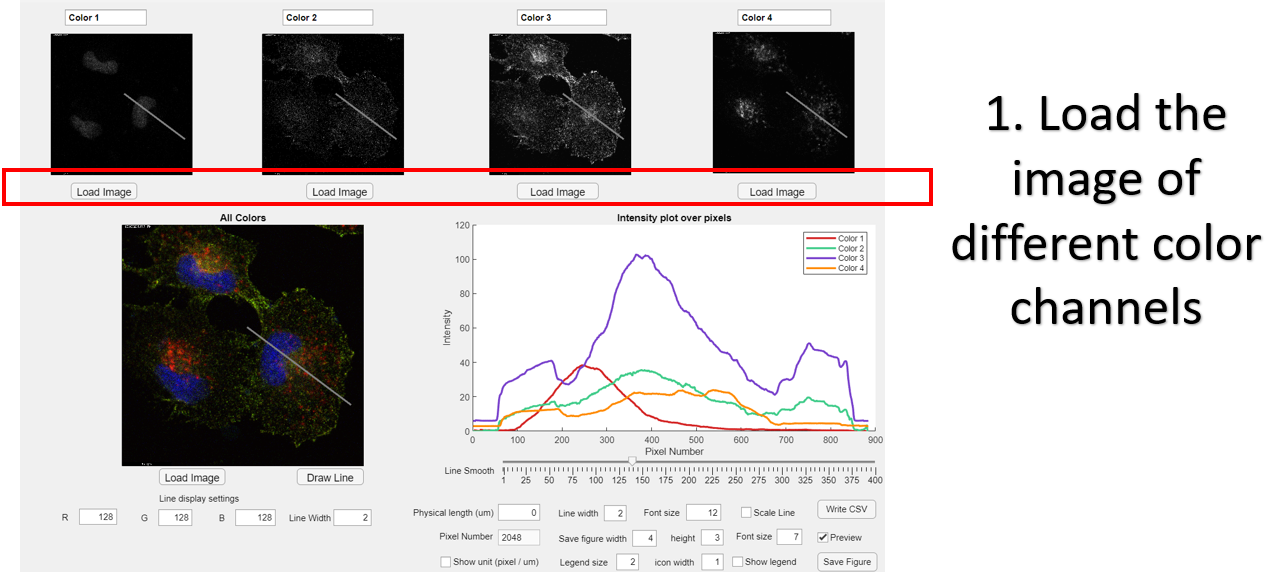
Load the image of different color channels
-
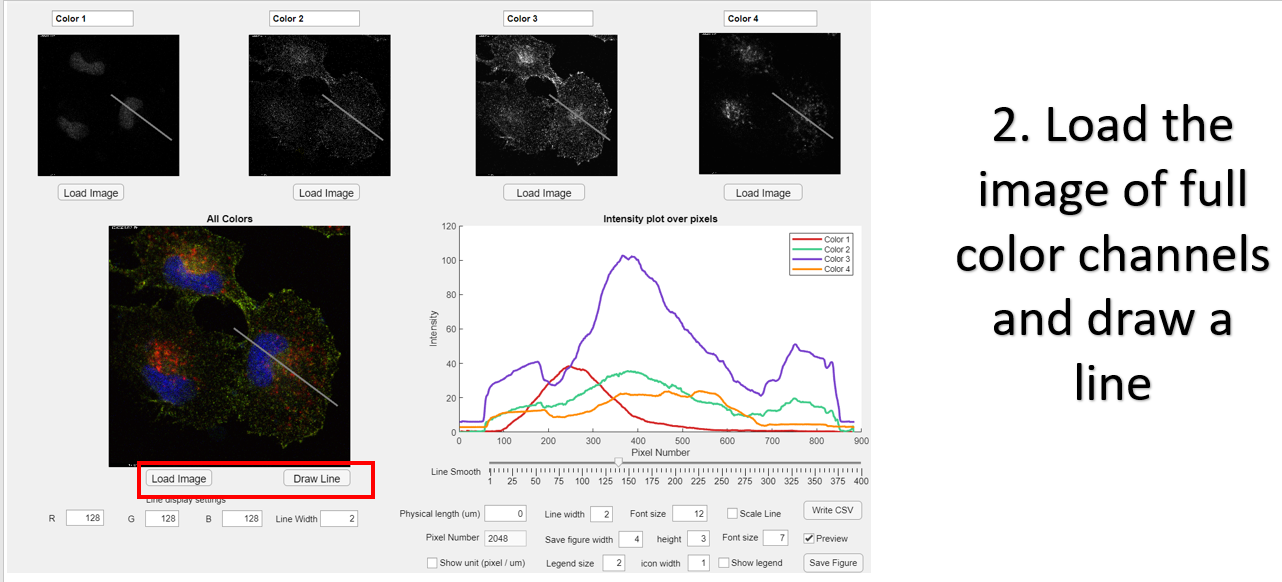
Load the image of full color channels and draw a line.
-
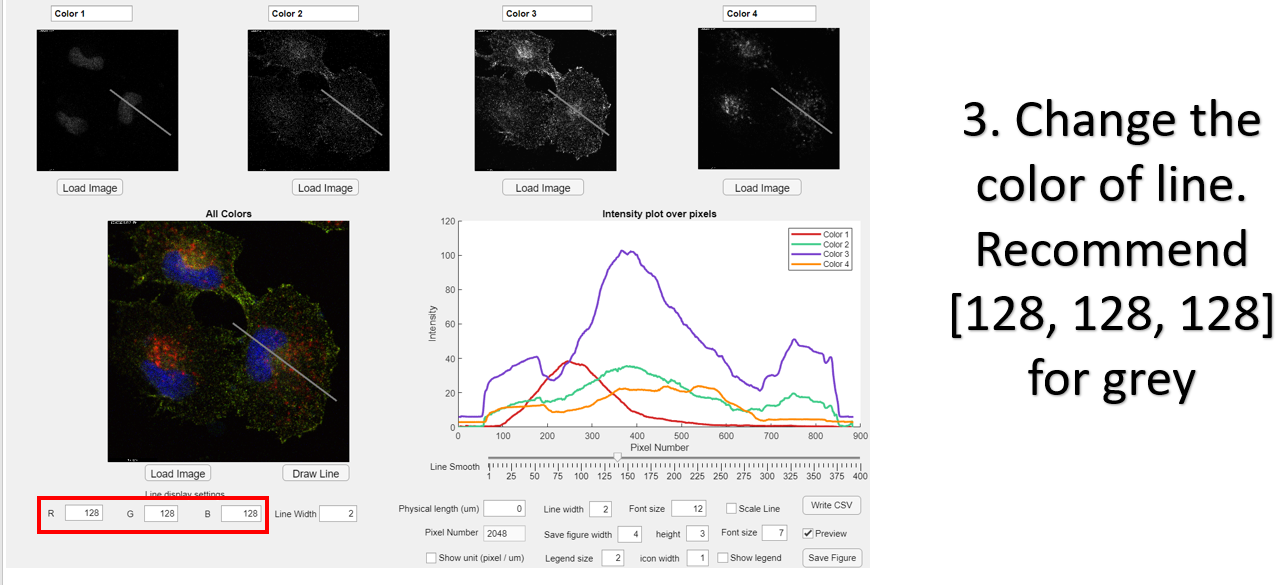
Change the color of line. Recommend [128, 128, 128] for grey.
-
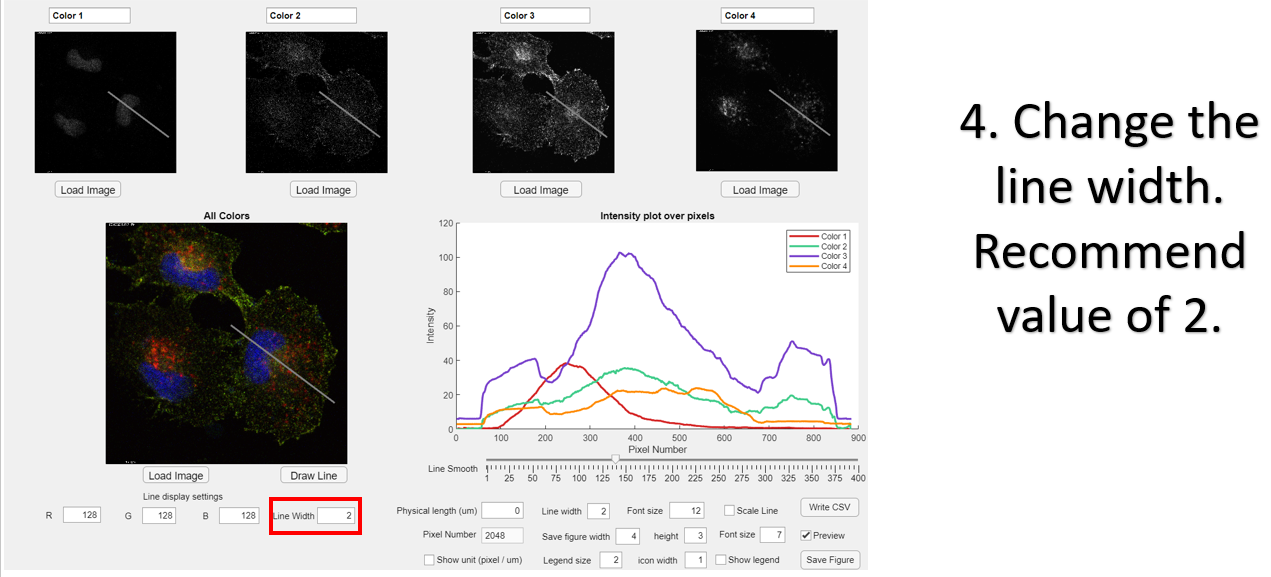
Change the line width. Recommend value of 2.
-
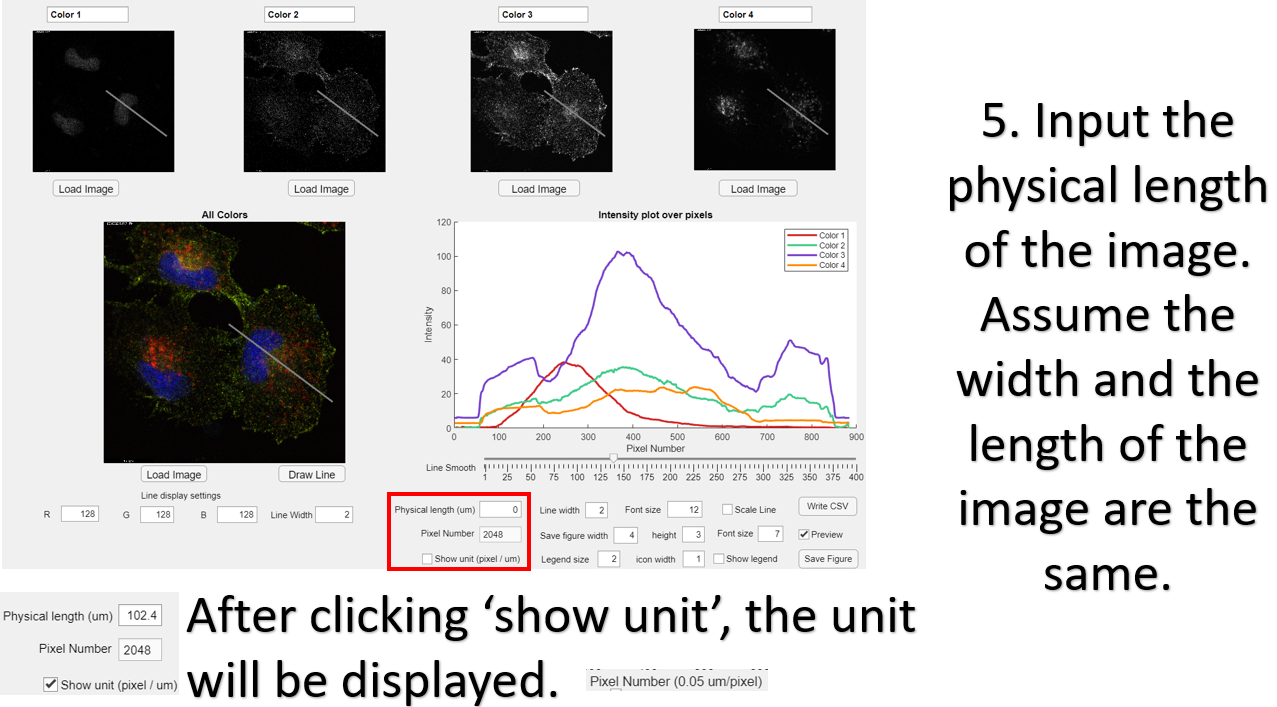
Input the physical length of the image. Assume the width and the length of the image are the same.
-
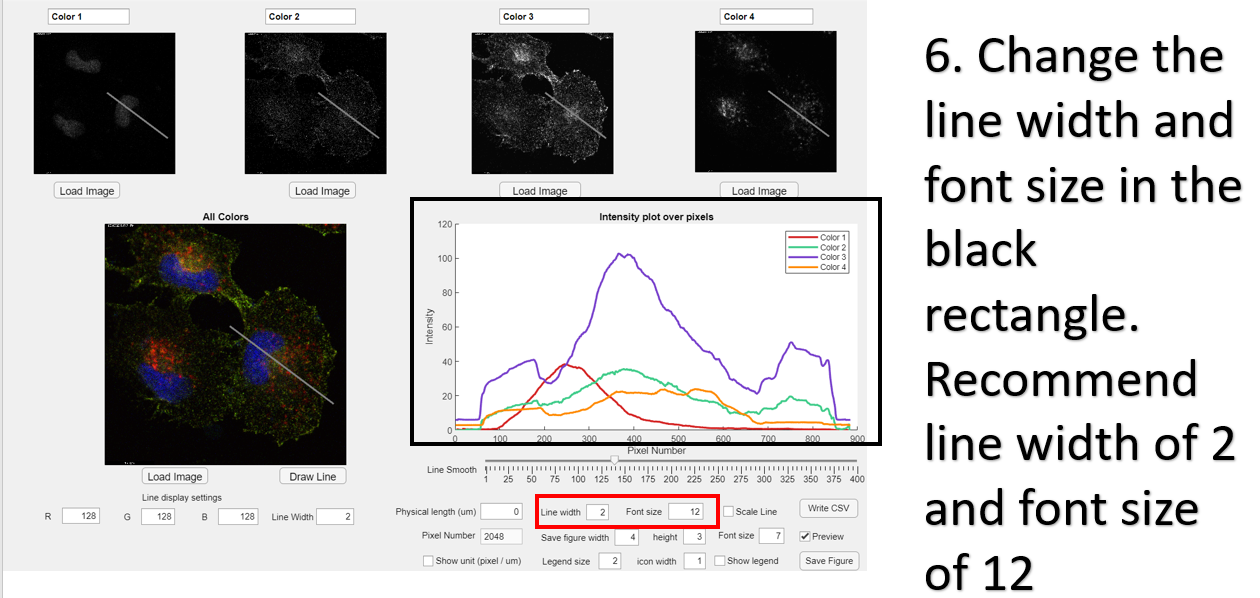
Change the line width and font size in the black rectangle. Recommend line width of 2 and font size of 12.
-
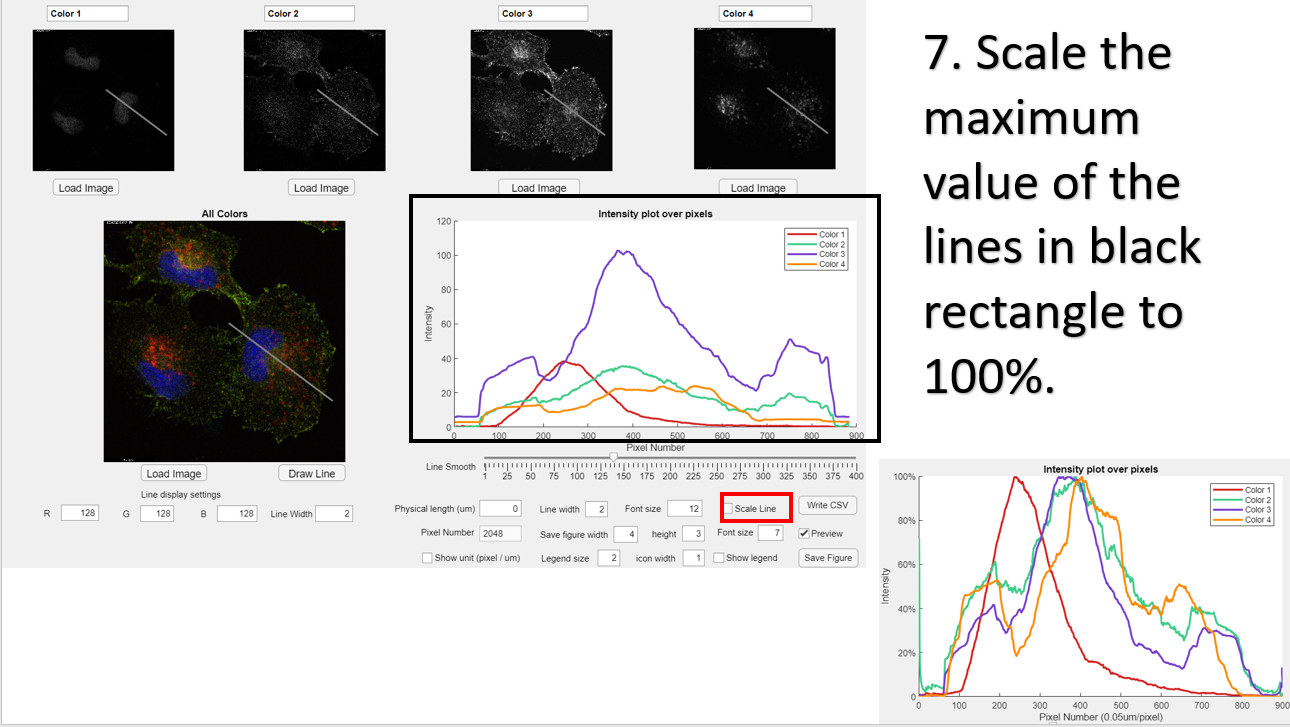
Scale the maximum value of the lines in black rectangle to 100%.
-
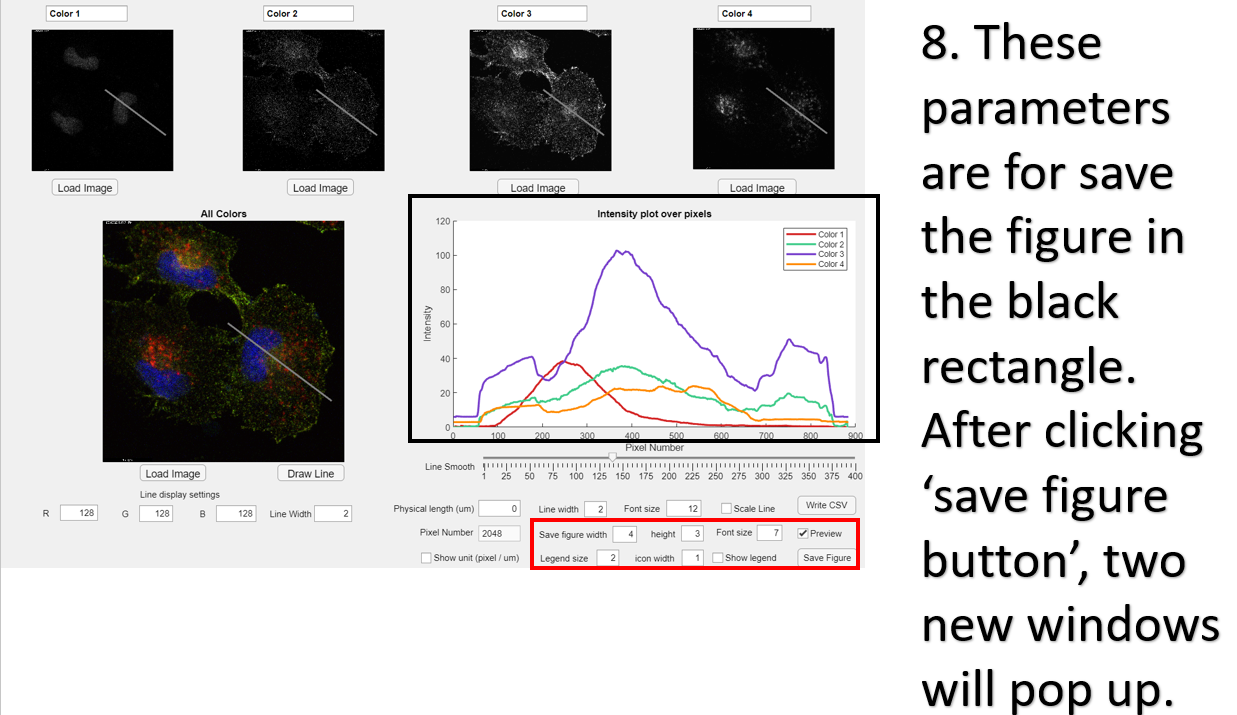
These parameters are for save the figure in the black rectangle. After clicking ‘save figure button’, two new windows will pop up.
-
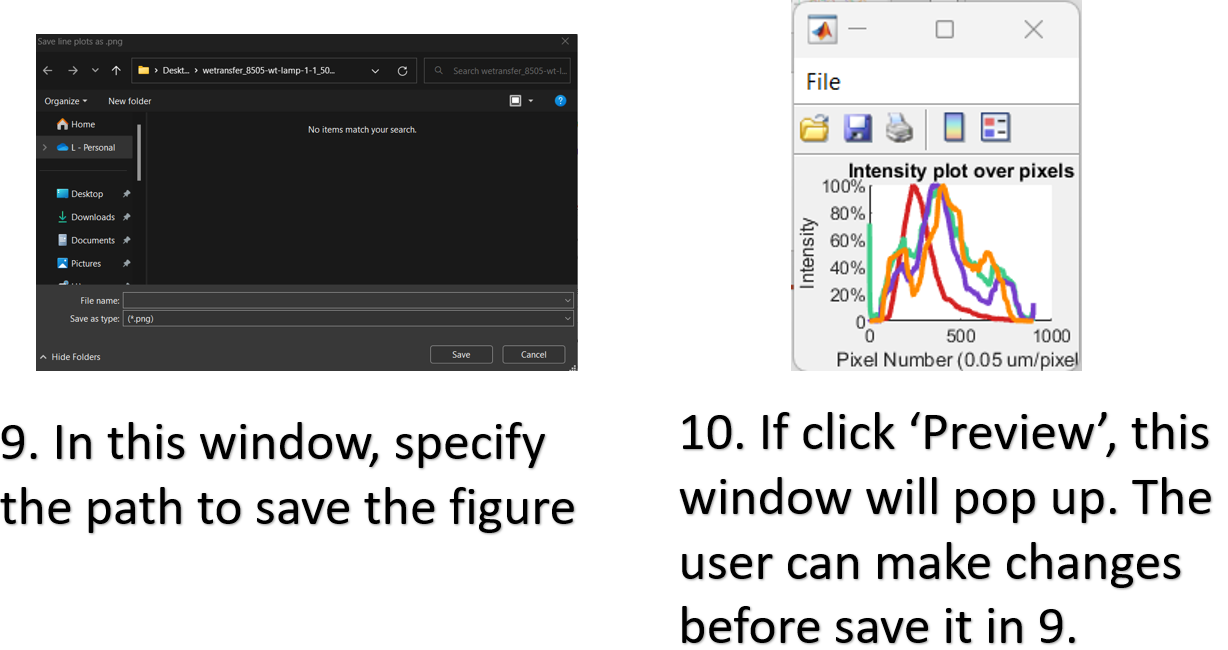
In this window, specify the path to save the figure.
-
If click ‘Preview’, this window will pop up. The user can make changes before save it in 9.
-
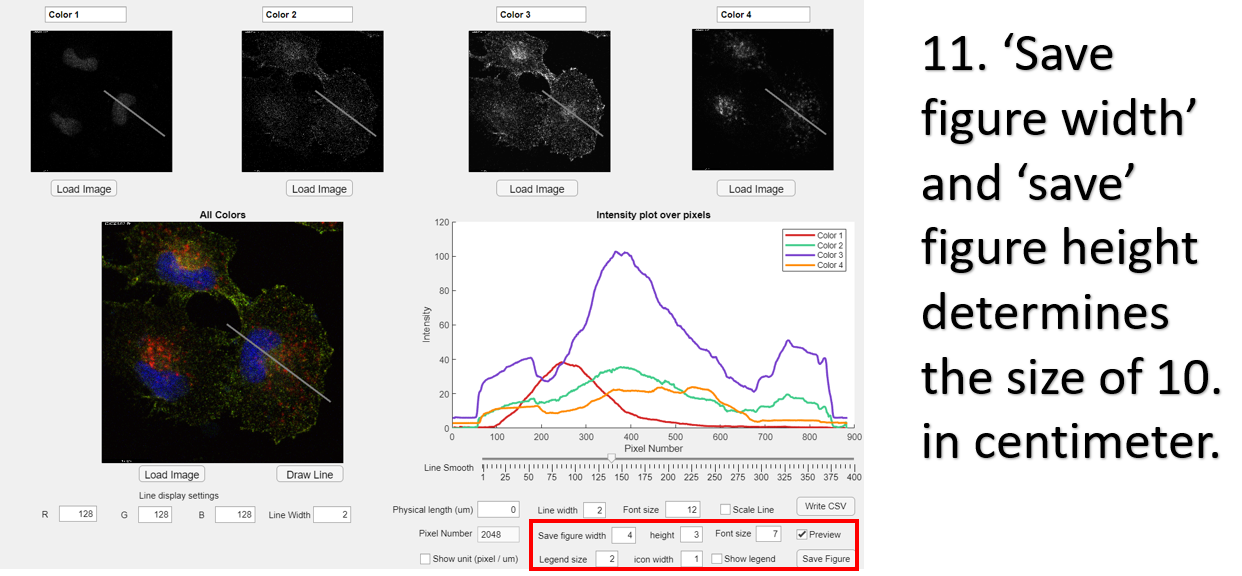
‘Save figure width’ and ‘save’ figure height determines the size of 10. in centimeter.
-
‘Font size’ determines the fonts in 10. Recommend a value of 7.

-
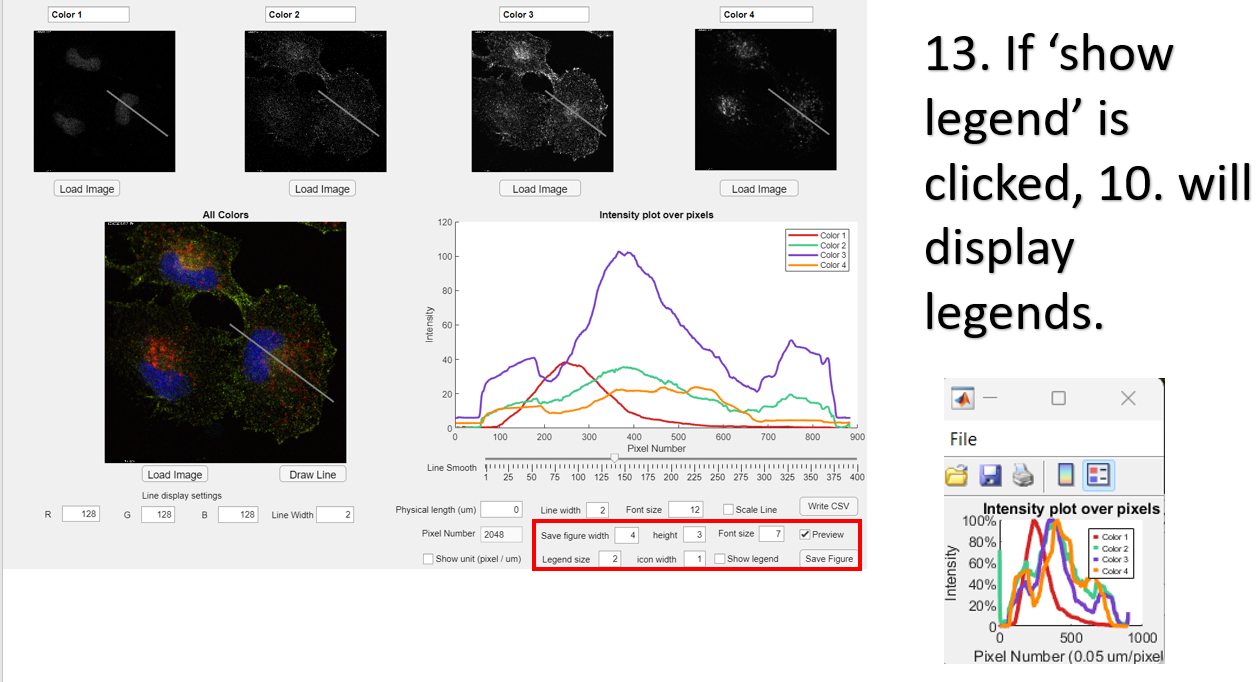
If ‘show legend’ is clicked, 10. will display legends.
-
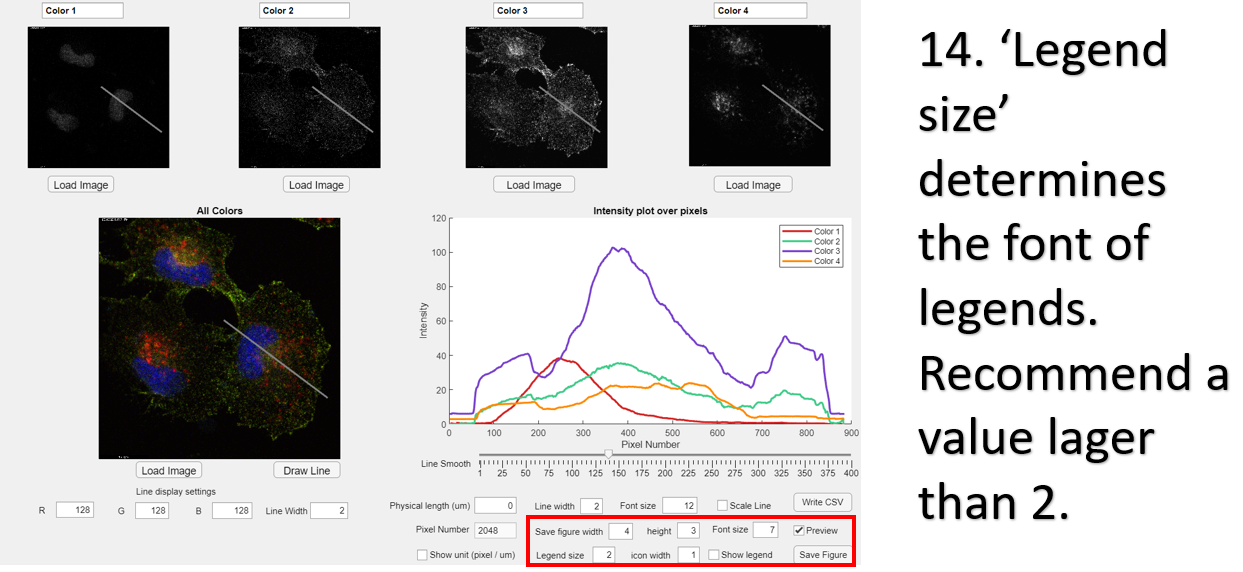
‘Legend size’ determines the font of legends. Recommend a value lager than 2.
-
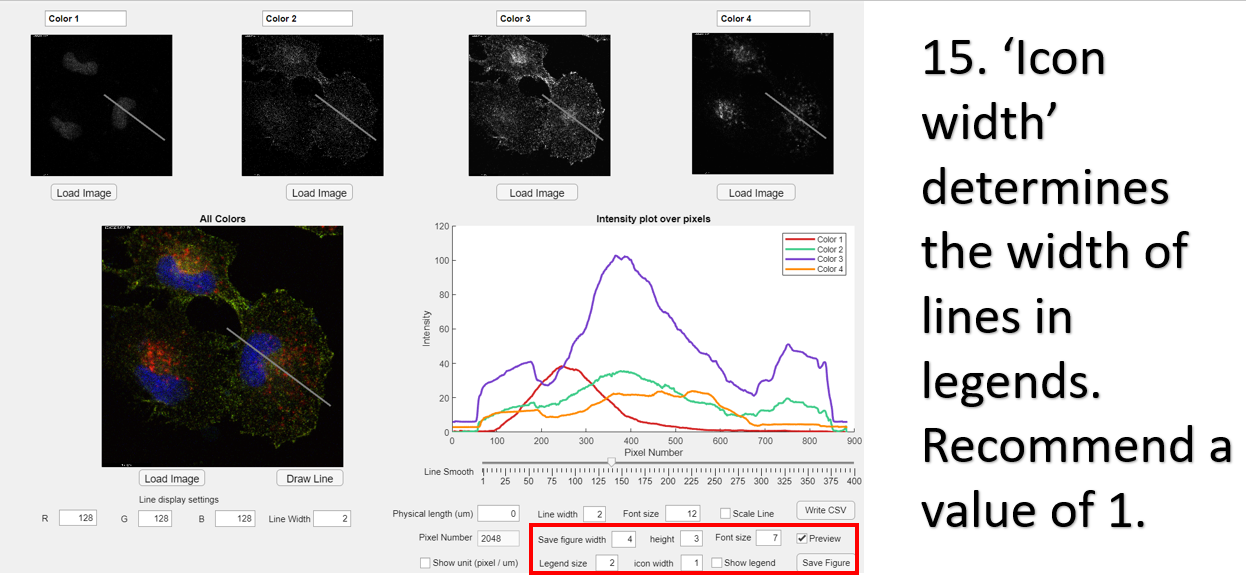
‘Icon width’ determines the width of lines in legends. Recommend a value of 1.
-
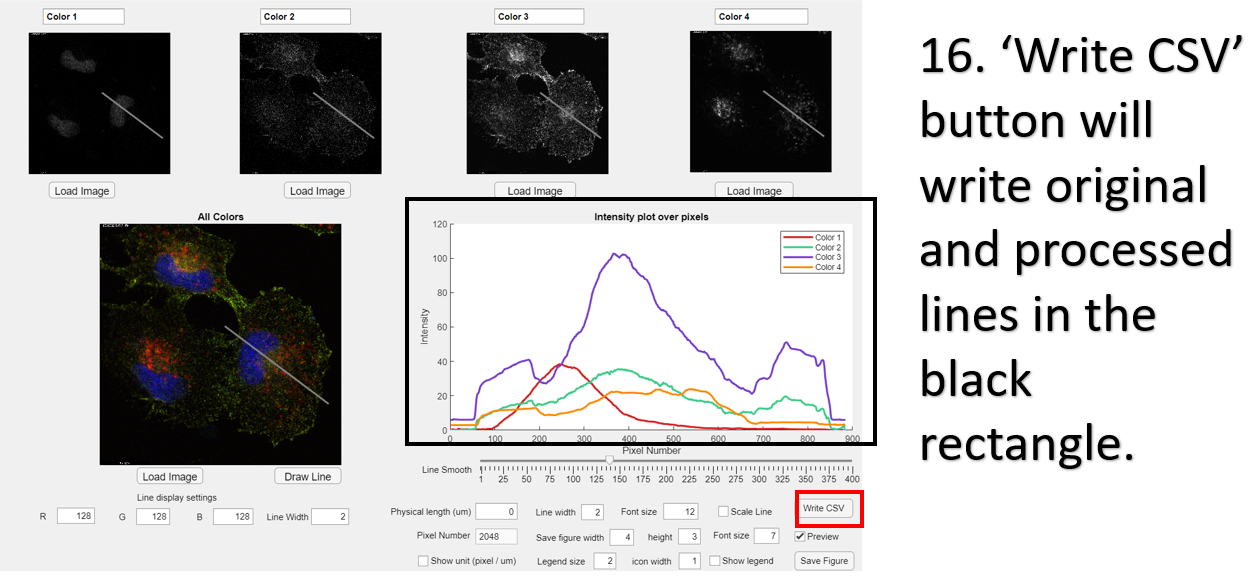
‘Write CSV’ button will write original and processed lines in the black rectangle.
-
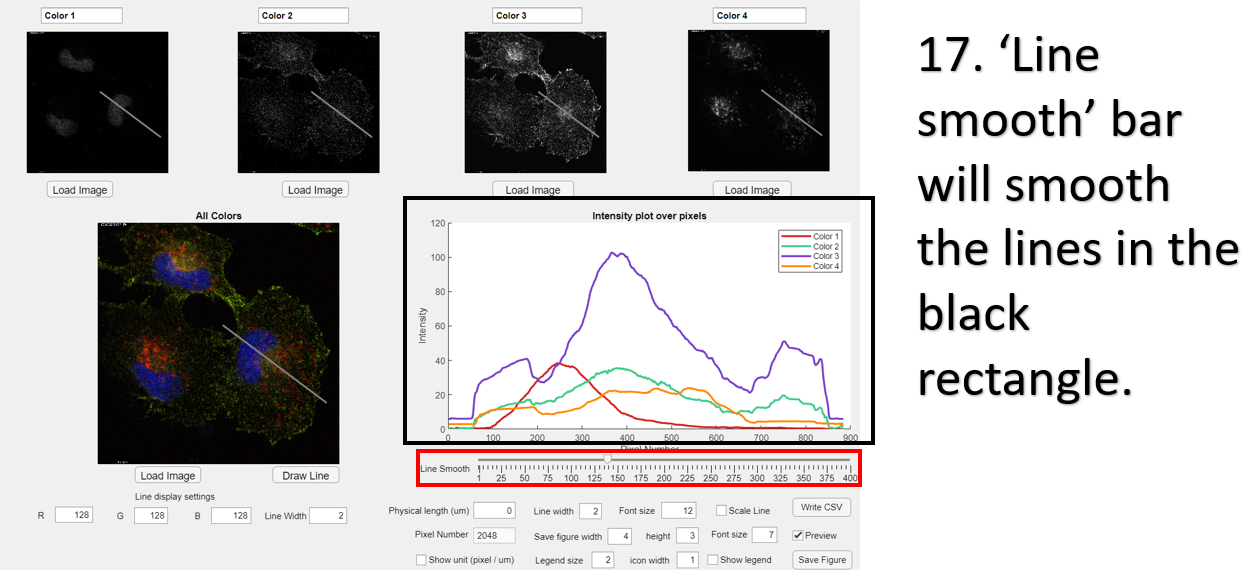
‘Line smooth’ bar will smooth the lines in the black rectangle.