Skip to content

Conversation

@mbrobbel
Copy link
Member

@mbrobbel mbrobbel commented Jan 7, 2022

Adds spans and events for exec plan and exec nodes.

I use the following setup to debug traces:

docker-compose.yml:

version: "2"
services:

  jaeger-all-in-one:
    image: jaegertracing/all-in-one:latest
    ports:
      - "16686:16686"
      - "14268"
      - "14250"

  otel-collector:
    image: otel/opentelemetry-collector-contrib-dev:latest
    command: ["--config=/etc/otel-collector-config.yaml"]
    volumes:
      - ./otel-collector-config.yaml:/etc/otel-collector-config.yaml
      - ./output:/var/output
    ports:
      - "8888:8888"   # Prometheus metrics exposed by the collector
      - "8889:8889"   # Prometheus exporter metrics
      - "4317"        # OTLP gRPC receiver
      - "4318:4318"   # OTLP HTTP receiver
    depends_on:      
      - jaeger-all-in-one

  prometheus:
    container_name: prometheus
    image: prom/prometheus:latest
    volumes:
      - ./prometheus.yaml:/etc/prometheus/prometheus.yml
    ports:
      - "9090:9090"

otel-collector-config.yaml:

receivers:
  otlp:
    protocols:
      grpc:
        endpoint: 0.0.0.0:4317
      http:
        endpoint: "0.0.0.0:4318"
        cors:
          allowed_origins:
            - "*"

processors:
  batch:

exporters:
  logging:
  jaeger:
    endpoint: jaeger-all-in-one:14250
    tls:
      insecure: true
  prometheus:
    endpoint: 0.0.0.0:8889
  parquet:
    path: /var/output/log.parquet

service:
  pipelines:
    traces:
      receivers:
        - otlp
      processors:
        - batch
      exporters:
        - logging
        - jaeger
        - parquet
    metrics:
      receivers:
        - otlp
      processors:
        - batch
      exporters:
        - logging
        - prometheus
        - parquet

prometheus.yaml:

scrape_configs:
  - job_name: "otel-collector"
    scrape_interval: 10s
    static_configs:
      - targets: ["otel-collector:8889"]
      - targets: ["otel-collector:8888"]

Start the services and then use the instructions from #11906.

@github-actions
Copy link

github-actions bot commented Jan 7, 2022

@lidavidm
Copy link
Member

lidavidm commented Jan 7, 2022

Cool! The macro definitions look fairly useful.

@lidavidm
Copy link
Member

lidavidm commented Jan 7, 2022

If you have a screenshot or any quick example of the output to share here it would also be useful, I think.

@mbrobbel
Copy link
Member Author

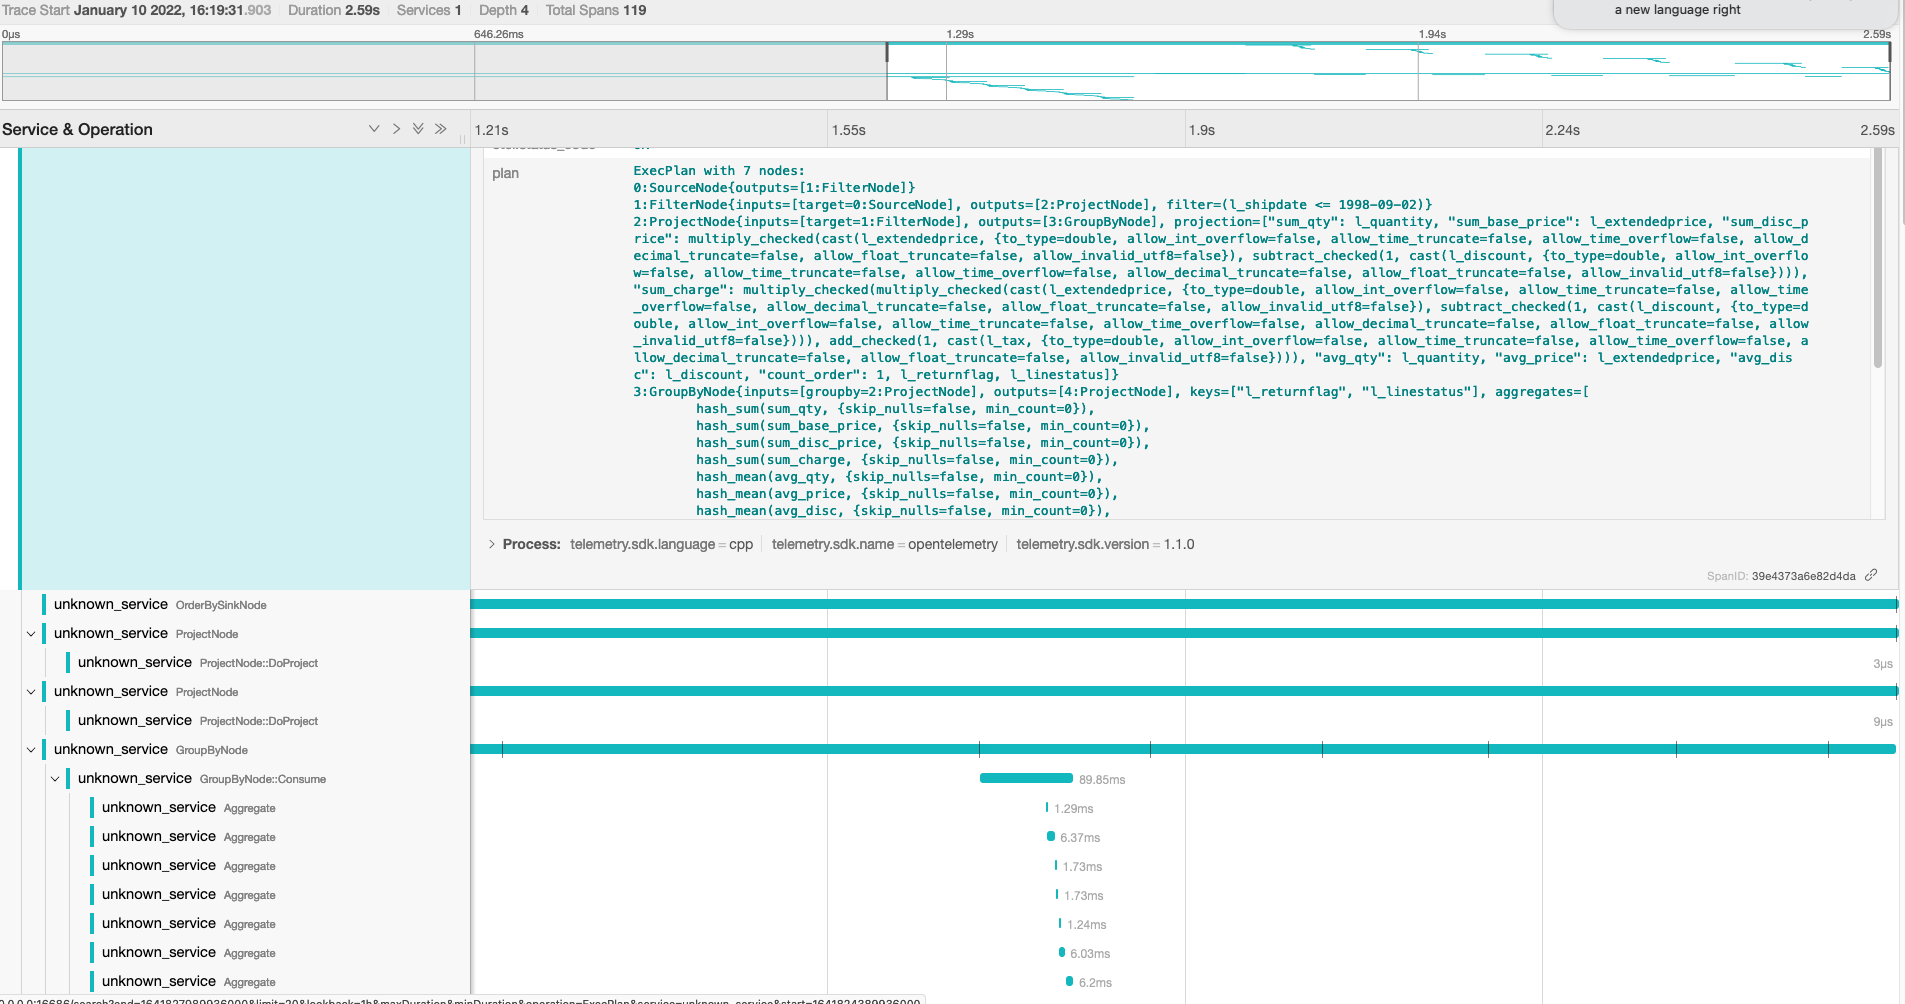
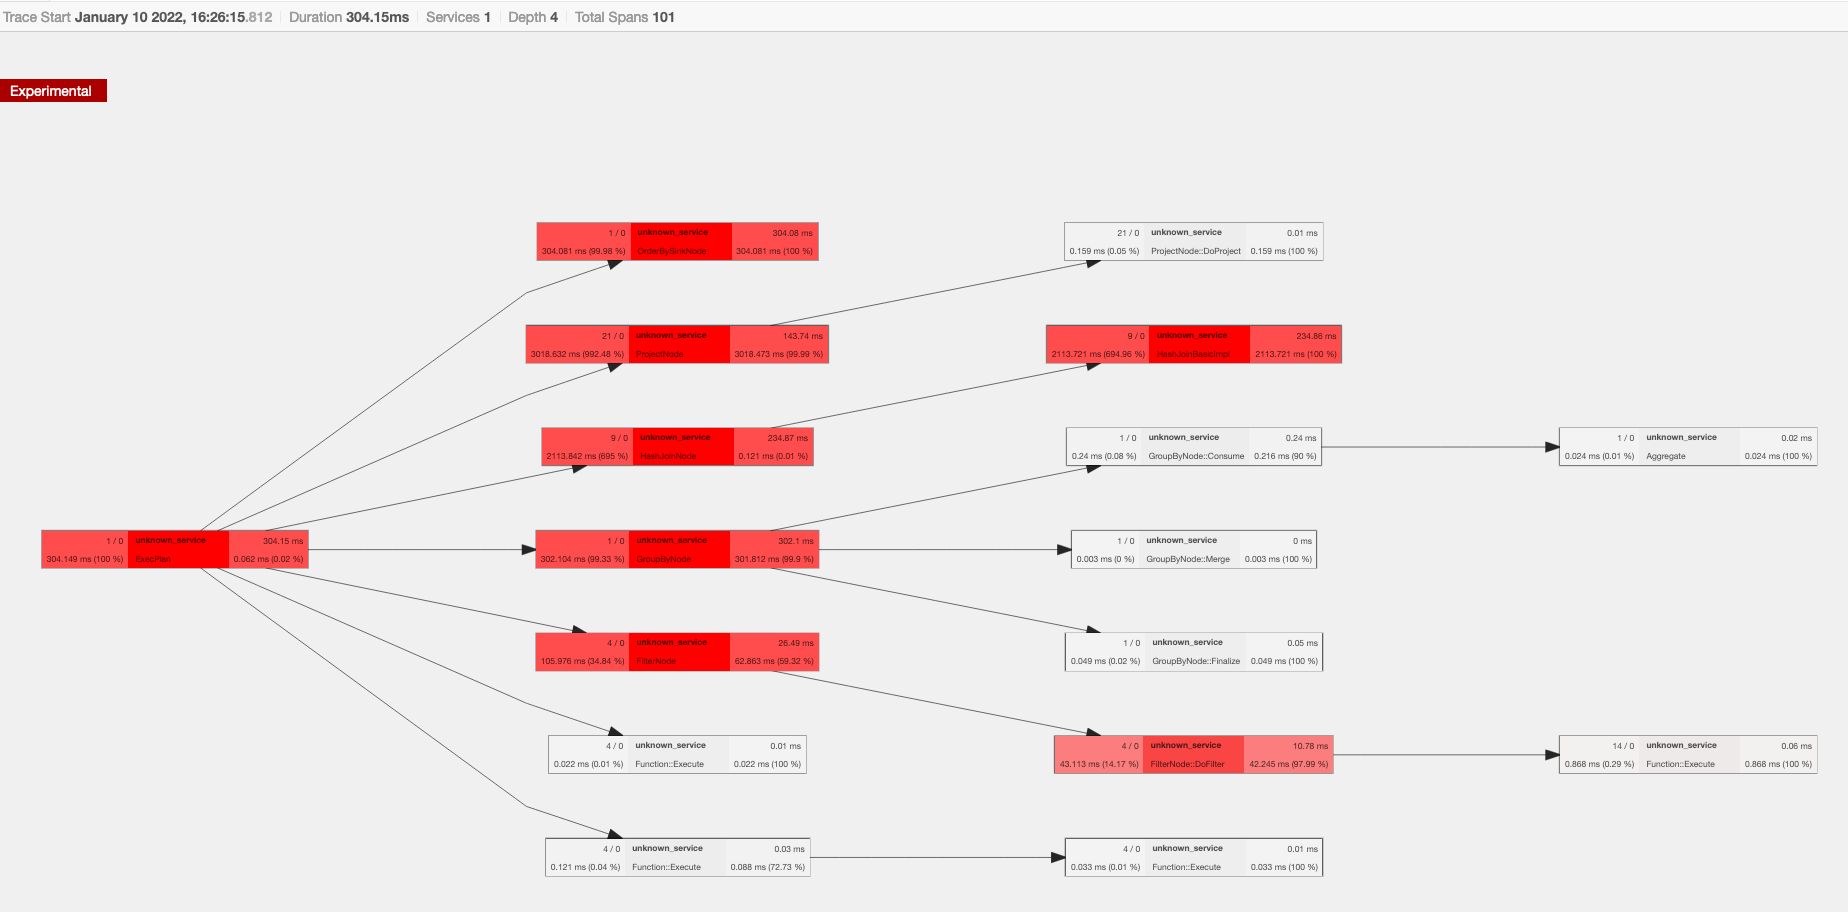
Some example output in Jaeger:
TPC-H query 1:

Screenshot 2022-01-10 at 16 24 36

TPC-H query 2:
Screenshot 2022-01-10 at 16 27 52

@mbrobbel mbrobbel marked this pull request as ready for review January 12, 2022 08:44
Copy link
Member

@lidavidm lidavidm left a comment

Choose a reason for hiding this comment

The reason will be displayed to describe this comment to others. Learn more.

Thanks, this looks good overall. I left some small comments.

Copy link
Member

@lidavidm lidavidm left a comment

Choose a reason for hiding this comment

The reason will be displayed to describe this comment to others. Learn more.

Thanks for doing this. Once we get this in, I'm pretty excited to see what sorts of analysis/visualization we can do.

MARK_SPAN(target_span, st); \
END_SPAN(target_span); \
return st; \
})
Copy link
Member

Choose a reason for hiding this comment

The reason will be displayed to describe this comment to others. Learn more.

This macro really makes me think we should consider just adding Span as a part of Future (and see how it impacts performance). That can be done later, though, I think we can get this in first and continue refining how we use OpenTelemetry.

@westonpace
Copy link
Member

@lidavidm @mbrobbel Is there any reason we can't merge this? If you want I can take a look through tomorrow and merge. Otherwise I took a quick scan and I think this is helpful information to get us started with instrumentation.

@mbrobbel
Copy link
Member Author

mbrobbel commented Feb 1, 2022

@lidavidm @mbrobbel Is there any reason we can't merge this? If you want I can take a look through tomorrow and merge. Otherwise I took a quick scan and I think this is helpful information to get us started with instrumentation.

There are still some comments from @lidavidm that I need to address, but I can do that tomorrow.

@lidavidm
Copy link
Member

lidavidm commented Feb 1, 2022

No further comments from me - let's merge once OrderBySinkNode is fully instrumented.

@lidavidm
Copy link
Member

lidavidm commented Feb 1, 2022

I want to base #11964 on top of this since the helpers here will simplify it.

@mbrobbel
Copy link
Member Author

mbrobbel commented Feb 2, 2022

@westonpace @lidavidm this is now ready for a final review.

Copy link
Member

@lidavidm lidavidm left a comment

Choose a reason for hiding this comment

The reason will be displayed to describe this comment to others. Learn more.

Thanks for working through this!

@lidavidm
Copy link
Member

lidavidm commented Feb 2, 2022

(For the record, edited description to remove username pings; those get put into the commit message and then generate a lot of notification spam.)

@lidavidm lidavidm closed this in 9b53235 Feb 2, 2022
@ursabot
Copy link

ursabot commented Feb 2, 2022

Benchmark runs are scheduled for baseline = 74deb45 and contender = 9b53235. 9b53235 is a master commit associated with this PR. Results will be available as each benchmark for each run completes.
Conbench compare runs links:
[Finished ⬇️0.0% ⬆️0.0%] ec2-t3-xlarge-us-east-2
[Failed ⬇️0.0% ⬆️0.36%] ursa-i9-9960x
[Finished ⬇️0.69% ⬆️0.0%] ursa-thinkcentre-m75q
Supported benchmarks:
ec2-t3-xlarge-us-east-2: Supported benchmark langs: Python. Runs only benchmarks with cloud = True
ursa-i9-9960x: Supported benchmark langs: Python, R, JavaScript
ursa-thinkcentre-m75q: Supported benchmark langs: C++, Java

Sign up for free to join this conversation on GitHub. Already have an account? Sign in to comment

Projects

None yet

Development

Successfully merging this pull request may close these issues.

4 participants