Version
4.5.0
Steps to reproduce
Use 2 xAxis 'time' with different dates (same time rate) from 00:00 to 23:45, 1 yAxis and 2 sensors data to show:
sensor 1: [ 1, 2, 3, 4, 5, 6, 7, 8, 9, 10]
sensor 2: [ 1, 2, 3, 4, 5, 6]
What is expected?
The two time axis align the label on top and bottom
What is actually happening?
'cause the sensor 2 has less data than the sensor 1, the vertical lines result unaligned.
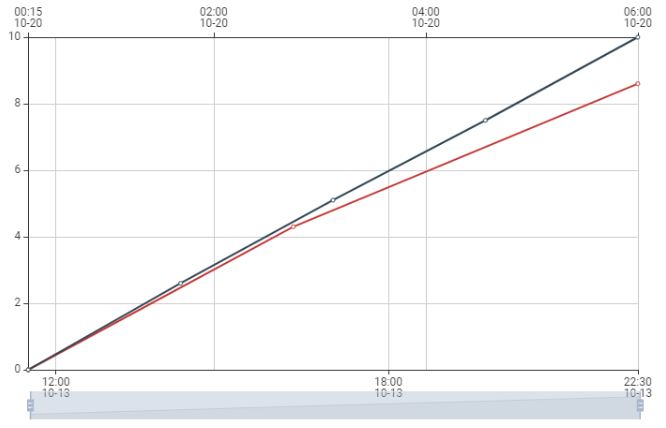
Also the comparison of the data is unaligned:
The labels starts usually at yyyy-dd-mm(1) 00:00 and yyyy-dd-mm(2) 00:00, but the time depends on the first data. Also the end:
Label sensor 1: (different date 1) 23:45 time of the last data
Label sensor 2: (different date 2) time of the last data
Version
4.5.0
Steps to reproduce
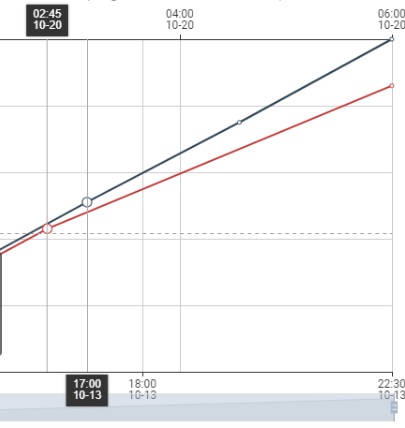
Use 2 xAxis 'time' with different dates (same time rate) from 00:00 to 23:45, 1 yAxis and 2 sensors data to show:
sensor 1: [ 1, 2, 3, 4, 5, 6, 7, 8, 9, 10]
sensor 2: [ 1, 2, 3, 4, 5, 6]
What is expected?
The two time axis align the label on top and bottom
What is actually happening?
'cause the sensor 2 has less data than the sensor 1, the vertical lines result unaligned.
Also the comparison of the data is unaligned:
The labels starts usually at yyyy-dd-mm(1) 00:00 and yyyy-dd-mm(2) 00:00, but the time depends on the first data. Also the end:
Label sensor 1: (different date 1) 23:45 time of the last data
Label sensor 2: (different date 2) time of the last data