Version
5.x
Reproduction link
5.x Not Working
https://www.makeapie.com/editor.html?c=xQ2PGNug3u&v=1
4.x Working
https://www.makeapie.com/editor.html?c=xQ2PGNug3u&v=2
Steps to reproduce
- Create a line chart
- Add a line series
- Set
yAxis.max to be a value less than the min value of the line series data
- Watch the rendered result
It seems bar series has the same issue.
What is expected?
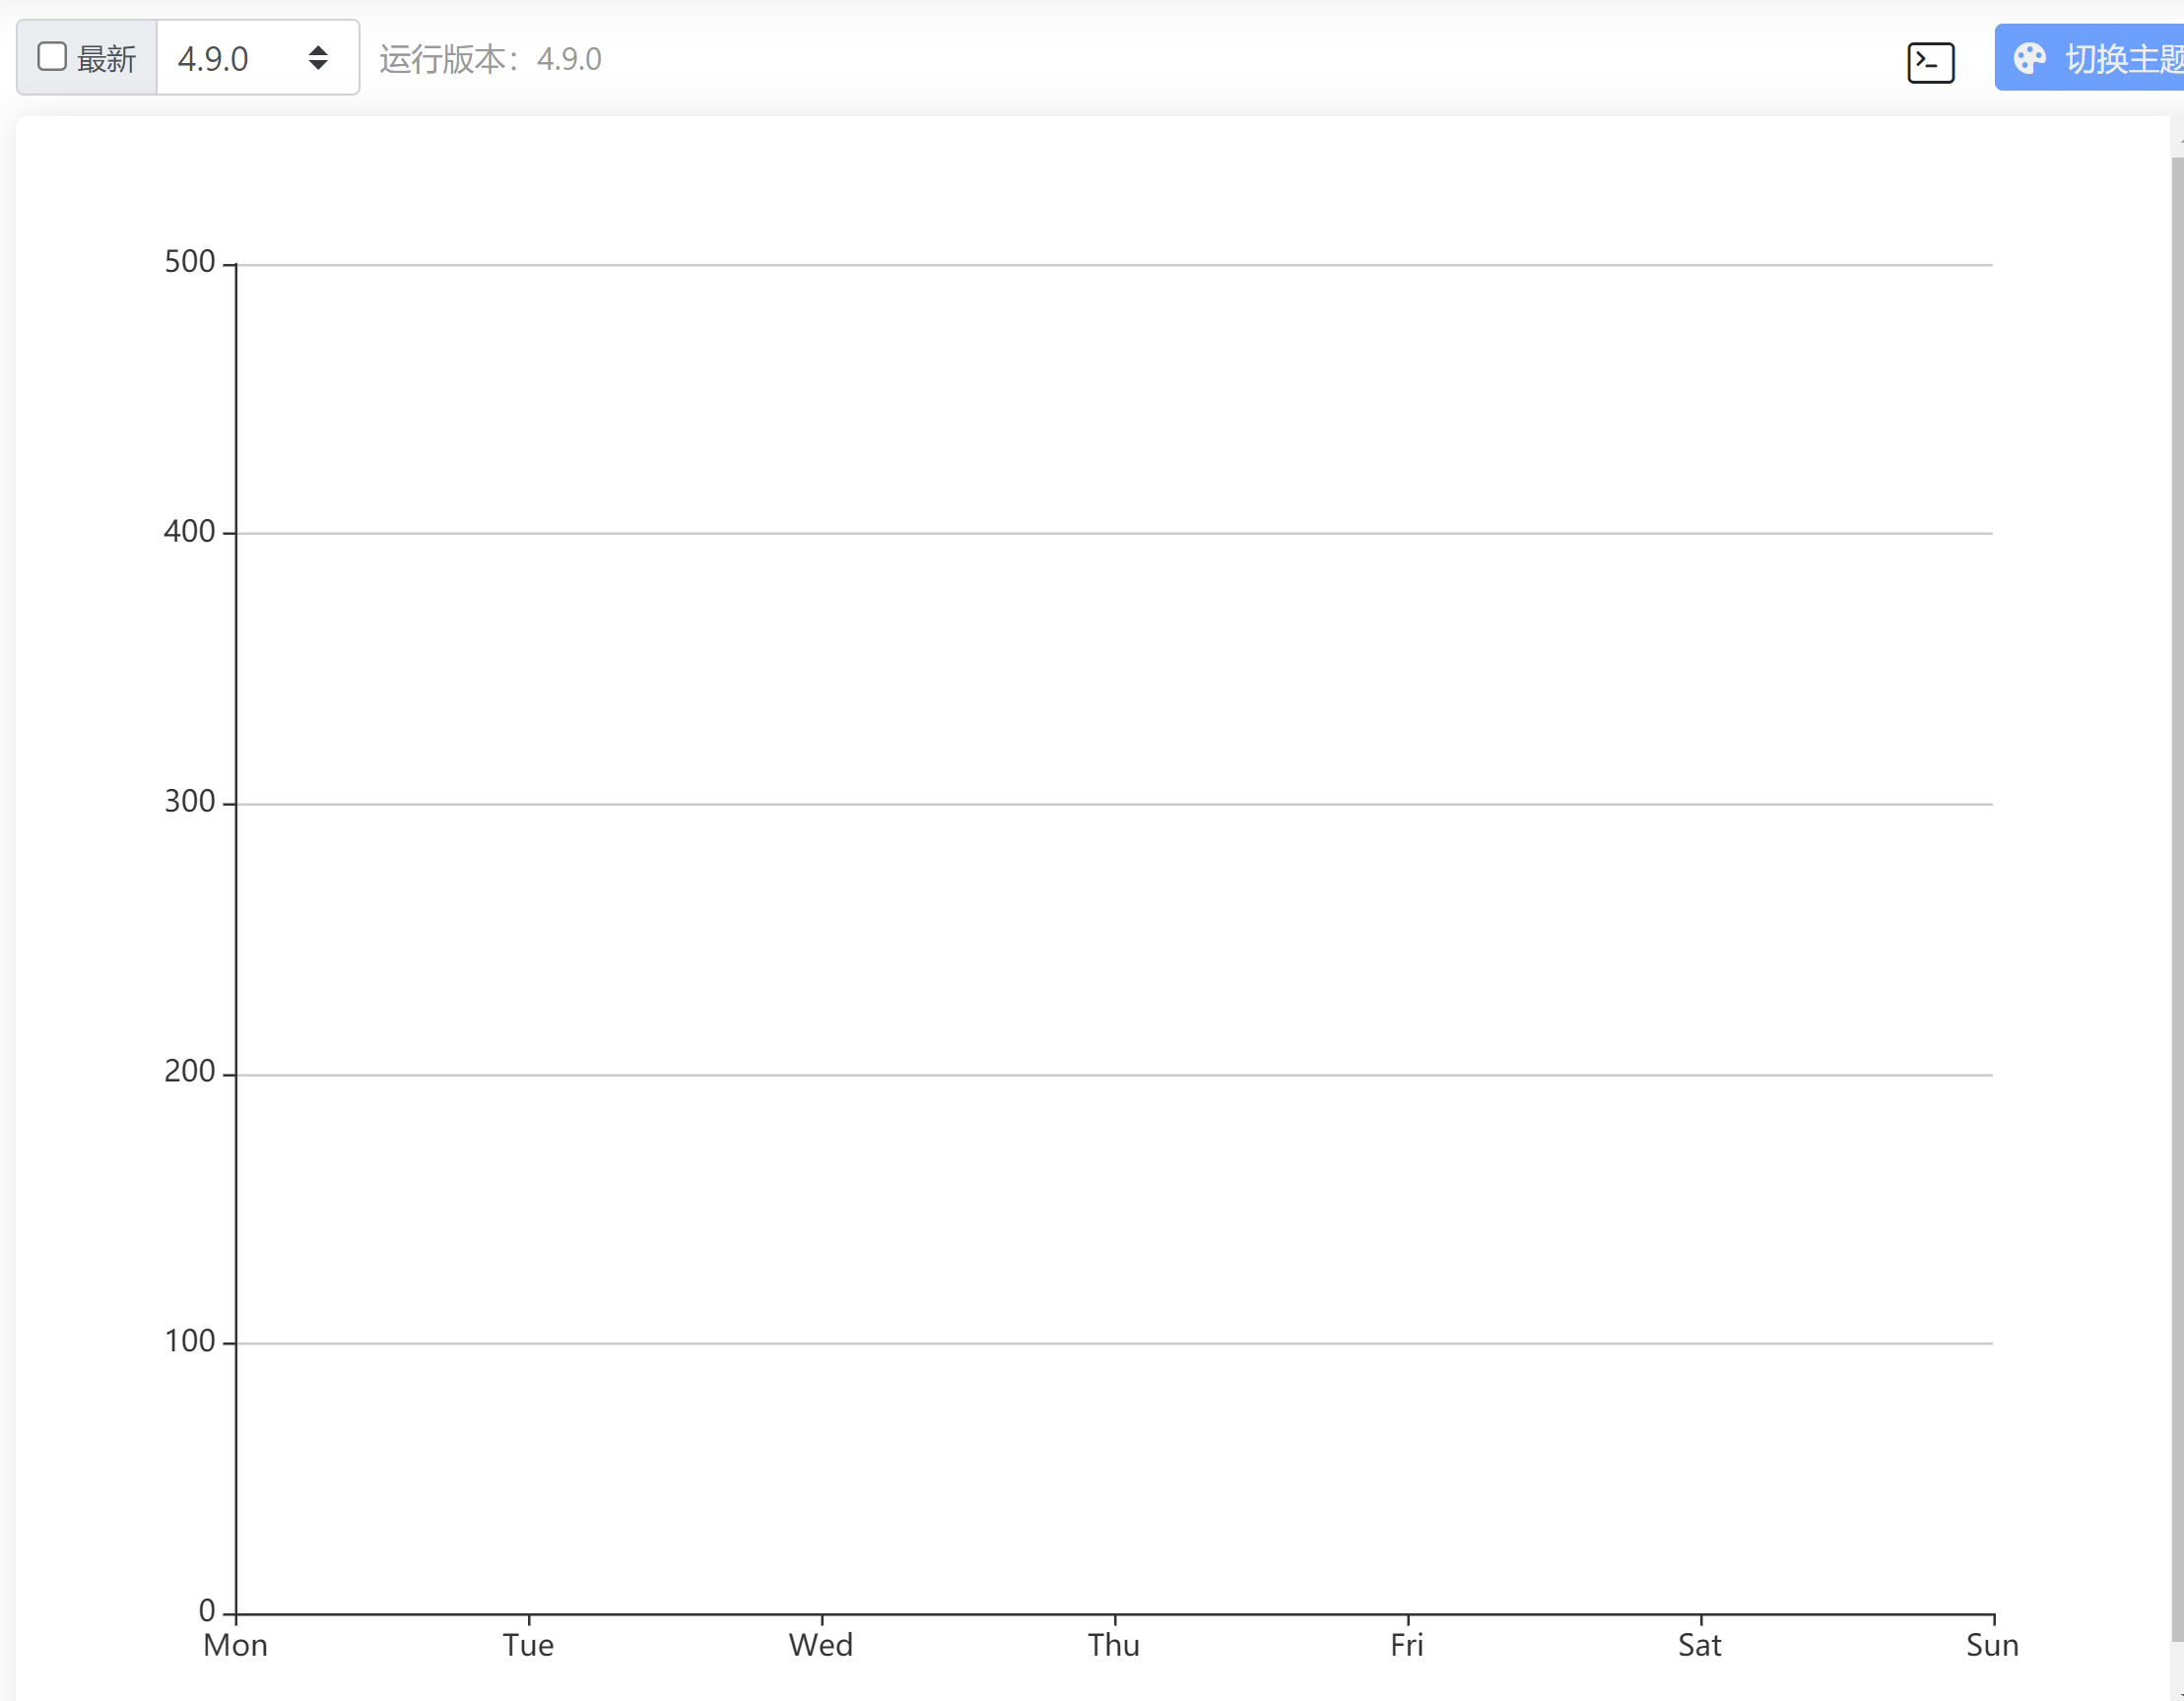
Nothing will be rendered like 4.x.
What is actually happening?
The line series is still here and the y-axis disappeared.


Version
5.x
Reproduction link
5.x Not Working
https://www.makeapie.com/editor.html?c=xQ2PGNug3u&v=1
4.x Working
https://www.makeapie.com/editor.html?c=xQ2PGNug3u&v=2
Steps to reproduce
yAxis.maxto be a value less than the min value of the line series dataIt seems
barseries has the same issue.What is expected?
Nothing will be rendered like 4.x.

What is actually happening?
The line series is still here and the y-axis disappeared.