Version
5.2.1
Reproduction link
https://codepen.io/alexander-txj/pen/xxdaOGa
Steps to reproduce
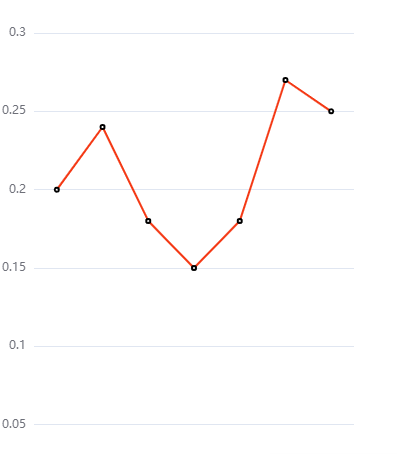
The curve should be drawn in black, but when the negative number is set to the minimum value, the curve is red; when the minimum value is set to 0, the curve drawing is normal again
What is expected?
The curve should be black
What is actually happening?
The result curve is red
Fix the error

Version
5.2.1
Reproduction link
https://codepen.io/alexander-txj/pen/xxdaOGa
Steps to reproduce
The curve should be drawn in black, but when the negative number is set to the minimum value, the curve is red; when the minimum value is set to 0, the curve drawing is normal again

What is expected?
The curve should be black
What is actually happening?
The result curve is red
Fix the error