Create a chart with a category axis and line and bar series.
Set markArea to [30, 40].
Add dataZoom option:
const seriesName = 'A Series name';

option = {
  tooltip: {
    show: true,
    trigger: 'axis'
  },
  xAxis: {
    type: 'category',
    data: ['10', '20', '30', '40', '50', '60', '70', '80', '90', '100', '110', '120', '130', '140', '150', '160', '170', '180', '190', '200'],
    splitArea: {
      show: true
    }
  },
  yAxis: {
    type: 'value'
  },
  series: [{
    name: seriesName,
    data: [820, 932, 901, 934, 1290, 1330, 1320, 820, 932, 901, 934, 1290, 1330, 1320, 820, 932, 901, 934, 1290, 1330],
    type: 'line',
    markArea: {
      data: [
        [{
          xAxis: '30'
        }, {
          xAxis: '40'
        }],
      ]
    }
  }],
  dataZoom: [{
      type: 'inside',
      xAxisIndex: 0,
      start: 10,
      end: 35,
    },
    {
      type: 'slider',
      show: true,
      xAxisIndex: 0,
      start: 10,
      end: 35,
    },
  ],

};


const chart1 = echarts.init(document.getElementById('themeChart1'))
chart1.setOption(option)

option.series[0].type = 'bar';
const chart2 = echarts.init(document.getElementById('themeChart2'))
chart2.setOption(option)
Try and zoom somewhere.
Line series shows markArea at correct place between 30 and 40.
When you zoom in bar series, the mark area jumps around to unexpected locations or disappears entirely.
The mark area should stay at [30, 40].
- OS: LinuxMint
- Browser: Chrome
Version
5.4.1
Link to Minimal Reproduction
https://jsfiddle.net/qrsfbwd9/
Steps to Reproduce
Create a chart with a category axis and line and bar series.
Set markArea to [30, 40].
Add dataZoom option:
Try and zoom somewhere.
Line series shows markArea at correct place between 30 and 40.
When you zoom in bar series, the mark area jumps around to unexpected locations or disappears entirely.
Current Behavior
When you set zoom to [10, 35], the mark area marks [50, 60]:
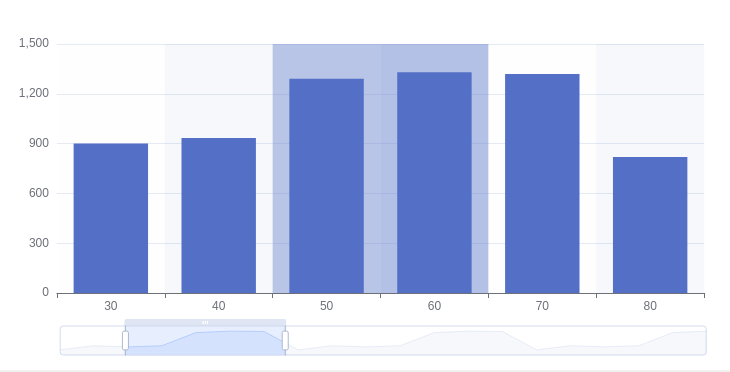
Expected Behavior
The mark area should stay at [30, 40].
Environment
Any additional comments?
No response