distsql: collect tableReader stats and output to trace#24529
Conversation
|
This change is |
|
Glad to see work in this direction! I was just wondering the other day how we could get better insights here. From the PR description, it looks like you're printing the stats into an event message. Have you considered making them tags instead? Instead of a message you could have tags of the type "tablereader.spans.read" -> 7 (and I'm anticipating that we'll have the RocksDB performance counters similarly). I'm not sure this is a better idea, btw, and even if it is it's straightforward to change it later. |
|
I haven't considered any alternatives to the trace output since I'm not too familiar with logging. Thanks for suggesting the tags, I'll try those out. |
|
Sounds good! I just want to reiterate that maybe this just won't work very well. But it's worth a quick experiment. (Even if you add tags, you probably still want to print it into the text so that it's properly exposed during |
|
Review status: 0 of 7 files reviewed at latest revision, all discussions resolved, all commit checks successful. pkg/sql/distsqlrun/data.proto, line 265 at r1 (raw file):
Streams that connect distsql processors have a Comments from Reviewable |
|
I think we need to resolve the question of how to send structured stats data back (e.g. to display in |
|
Review status: 0 of 7 files reviewed at latest revision, 1 unresolved discussion, all commit checks successful. pkg/sql/distsqlrun/data.proto, line 265 at r1 (raw file): Previously, petermattis (Peter Mattis) wrote…
I was thinking that this Comments from Reviewable |
|
The idea of using span tags for this information seems weird to me. If a processor collects 5 stats, would that be on tag or 5? Would they really look nice in the Jaegar UI? One argument I'd maybe buy was if putting them as tags would let any of the tracing services provide structured searching over them. But I doubt it... The way we've returned structured info from processors so far is through Review status: 0 of 7 files reviewed at latest revision, 1 unresolved discussion, all commit checks successful. pkg/sql/distsqlrun/data.proto, line 265 at r1 (raw file): Previously, asubiotto (Alfonso Subiotto Marqués) wrote…
An "input" is a stream, right? So I think it makes sense to rename this to Comments from Reviewable |
Could you elaborate on why that seems weird to you? Think of a span like a For example, if you want to know how many rows you've read, you let every tablereader's span emit a count Baggage items are not the right choice here. The storage layer does not need to know how many rows the table reader on top of it has already read. Review status: 0 of 7 files reviewed at latest revision, 1 unresolved discussion, all commit checks successful. Comments from Reviewable |
My mind is not set on this, so let me ask you a question in return: any log message provides some information (at the very lease its presence/absence is a bit). What nuggets of this information should be tags? Review status: 0 of 7 files reviewed at latest revision, 1 unresolved discussion, all commit checks successful. Comments from Reviewable |
|
Review status: 0 of 7 files reviewed at latest revision, 1 unresolved discussion, all commit checks successful. pkg/sql/distsqlrun/data.proto, line 265 at r1 (raw file): Previously, andreimatei (Andrei Matei) wrote…
TIL, I thought streams were only remote. It's not in conflict, but I'm not sure what we get out of having a Comments from Reviewable |
|
Log messages are meant for human consumption and so their form can change from one day to the next (you don't go around wondering whether changing a I don't think that you're seriously suggesting that we don't use tags and instead parse the information out of log messages because well, not having to do that is exactly why tags exist. See https://github.com/opentracing/specification/blob/master/semantic_conventions.md for some intuition about span tags. Tags are usually something like Take a look at the tentative API below. We should show the tags in const keysRead = 12515 // example
log.CountEvent(ctx, "tablereader.keys", keysRead)
// ^- calls
// (opentracing.Span).SetTag("count.tablereader.keys", fmt.Sprintf("%v", keysRead))But the upside is that you can imagine running (mod syntax bikeshed) I'm not sure what everyone else's experience is, but I've often wanted to isolate specific information from a trace and that has always been a problem since everything is currently unstructured. Would be good to change that. This proposal isn't perfect because what if Happy to chat about this more and help out if what I'm proposing is determined worth a shot but hits a snag. Review status: 0 of 7 files reviewed at latest revision, 1 unresolved discussion, all commit checks successful. Comments from Reviewable |
Well, actually, we already have logs that we can't change willy-nilly because of the damn "KV tracing" - those are logs selected by some regex. Anyway, as I was telling you, I am inspired by the idea of doing something for these stats which is not specific to DistSQL and also about a metrics-like API, and I guess that reflecting these things in tags rather than messages makes sense. In fact, I think we should access all the metrics that we already have through such an API so that the metrics that a request contributed to are reflected in that request's trace. "What if CountEvent is called multiple times for a span" is something that we really need to decide on though, as is what we want to aggregate per span and what we want to aggregate across spans too. For example, when I run a Review status: 0 of 7 files reviewed at latest revision, 1 unresolved discussion, all commit checks successful. Comments from Reviewable |
|
@tschottdorf while I am agnostic on whether tags are the best way to do things conceptually, I'd like to point out that our current implementation of tags (using a linked list of tag structs implementing the Context interface, which need to be traversed to arrive to the actual context) is not performance-friendly with larger tag sets. Until we solve that implementation problem I'd say we shouldn't use tags unless a specific benchmark measures the corresponding overhead. |
|
@knz you're talking about the wrong tags 😄 My "tags" are On a related note though, I was thinking what we are really winning by the use of opentracing tags and it's not much. Sure, the various opentracing-compatible tools will allow us to search spans by tag which is nice. But for a metrics-y use case, that seems mostly not very interesting, and being forced into all-strings is pretty terrible for things that are mostly integers. So what if instead we put a struct with performance counters in (our impl of) span which is then recorded in @andreimatei, what do you think? This seems relatively straightforward to prototype. |
|
@tschottdorf I think this @solongordon, this PR is ready for a review after I resolve the merge conflicts. |
|
Review status: 0 of 7 files reviewed at latest revision, 1 unresolved discussion. pkg/sql/distsqlrun/stats.go, line 57 at r3 (raw file):
Nit: Do you know what the deal is with the blank line in the trace output? pkg/sql/distsqlrun/stats.go, line 58 at r3 (raw file):
I would personally find a simple "rows read: 7" format to be more readable, but I'm also happy to wait on bikeshedding this. Comments from Reviewable |
Will be used by processors in future commits. Currently only counts the number of rows read but will be extended. Release note: None
Just number of rows read for now. This information is only collected and output if the tracing span is recording. Part of work for #19476 Release note: None
|
Review status: 0 of 7 files reviewed at latest revision, 3 unresolved discussions. pkg/sql/distsqlrun/stats.go, line 57 at r3 (raw file): Previously, solongordon (Solon) wrote…
No idea. I changed to follow the same format as runtime stats: pkg/sql/distsqlrun/stats.go, line 58 at r3 (raw file): Previously, solongordon (Solon) wrote…
Changed the format, I agree with you. Had the width to make more stats easier to read. Comments from Reviewable |
|
bors r+ |
24529: distsql: collect tableReader stats and output to trace r=asubiotto a=asubiotto
This PR is split into two commits. The first commit lays the groundwork for stat collection code. The stats are modeled as a proto to be sent over the wire in the future (we will be sending these stats as metadata). The second commit modifies the tableReader to use this InputStatCollector to count the number of rows it reads. Example usage:
```
root@:26257/> SELECT COUNT(*) FROM test.xyz;
+-------+
| count |
+-------+
|     7 |
+-------+
(1 row)

Time: 257.249037ms

root@:26257/> SET tracing = ON;
SET

Time: 362.575µs

root@:26257/> SELECT x,y,z FROM test.xyz ORDER BY x;
+---+---+------+
| x | y |  z   |
+---+---+------+
| 1 | 1 | NULL |
| 1 | 1 |    2 |
| 1 | 1 |    2 |
| 1 | 2 |    1 |
| 2 | 2 |    3 |
| 4 | 5 |    6 |
| 4 | 1 |    6 |
+---+---+------+
(7 rows)

Time: 207.334037ms

root@:26257/> SHOW TRACE FOR SESSION;

... rest of trace elided ...

| 2018-04-05 20:53:01.571467+00:00 | 21s794ms540µs951ns | waiting for read lock                                                    | [n1,s1,r23/1:/Table/5{2-3}]                                |     | /cockroach.roachpb.Internal/Batch |   13 |
| 2018-04-05 20:53:01.777272+00:00 | 22s345µs429ns      | read completed                                                           | [n1,s1,r23/1:/Table/5{2-3}]                                |     | /cockroach.roachpb.Internal/Batch |   13 |
| 2018-04-05 20:53:01.777435+00:00 | 22s508µs797ns      | stat summary for tableReader input                                       | [client=[::1]:64047,user=root,n1,TableReader]              |     | table reader                      |   11 |
|                                  |                    |                                                                          |                                                            |     |                                   |      |
|                                  |                    |  rows read         7                                                     |                                                            |     |                                   |      |

... rest of trace elided ...
```
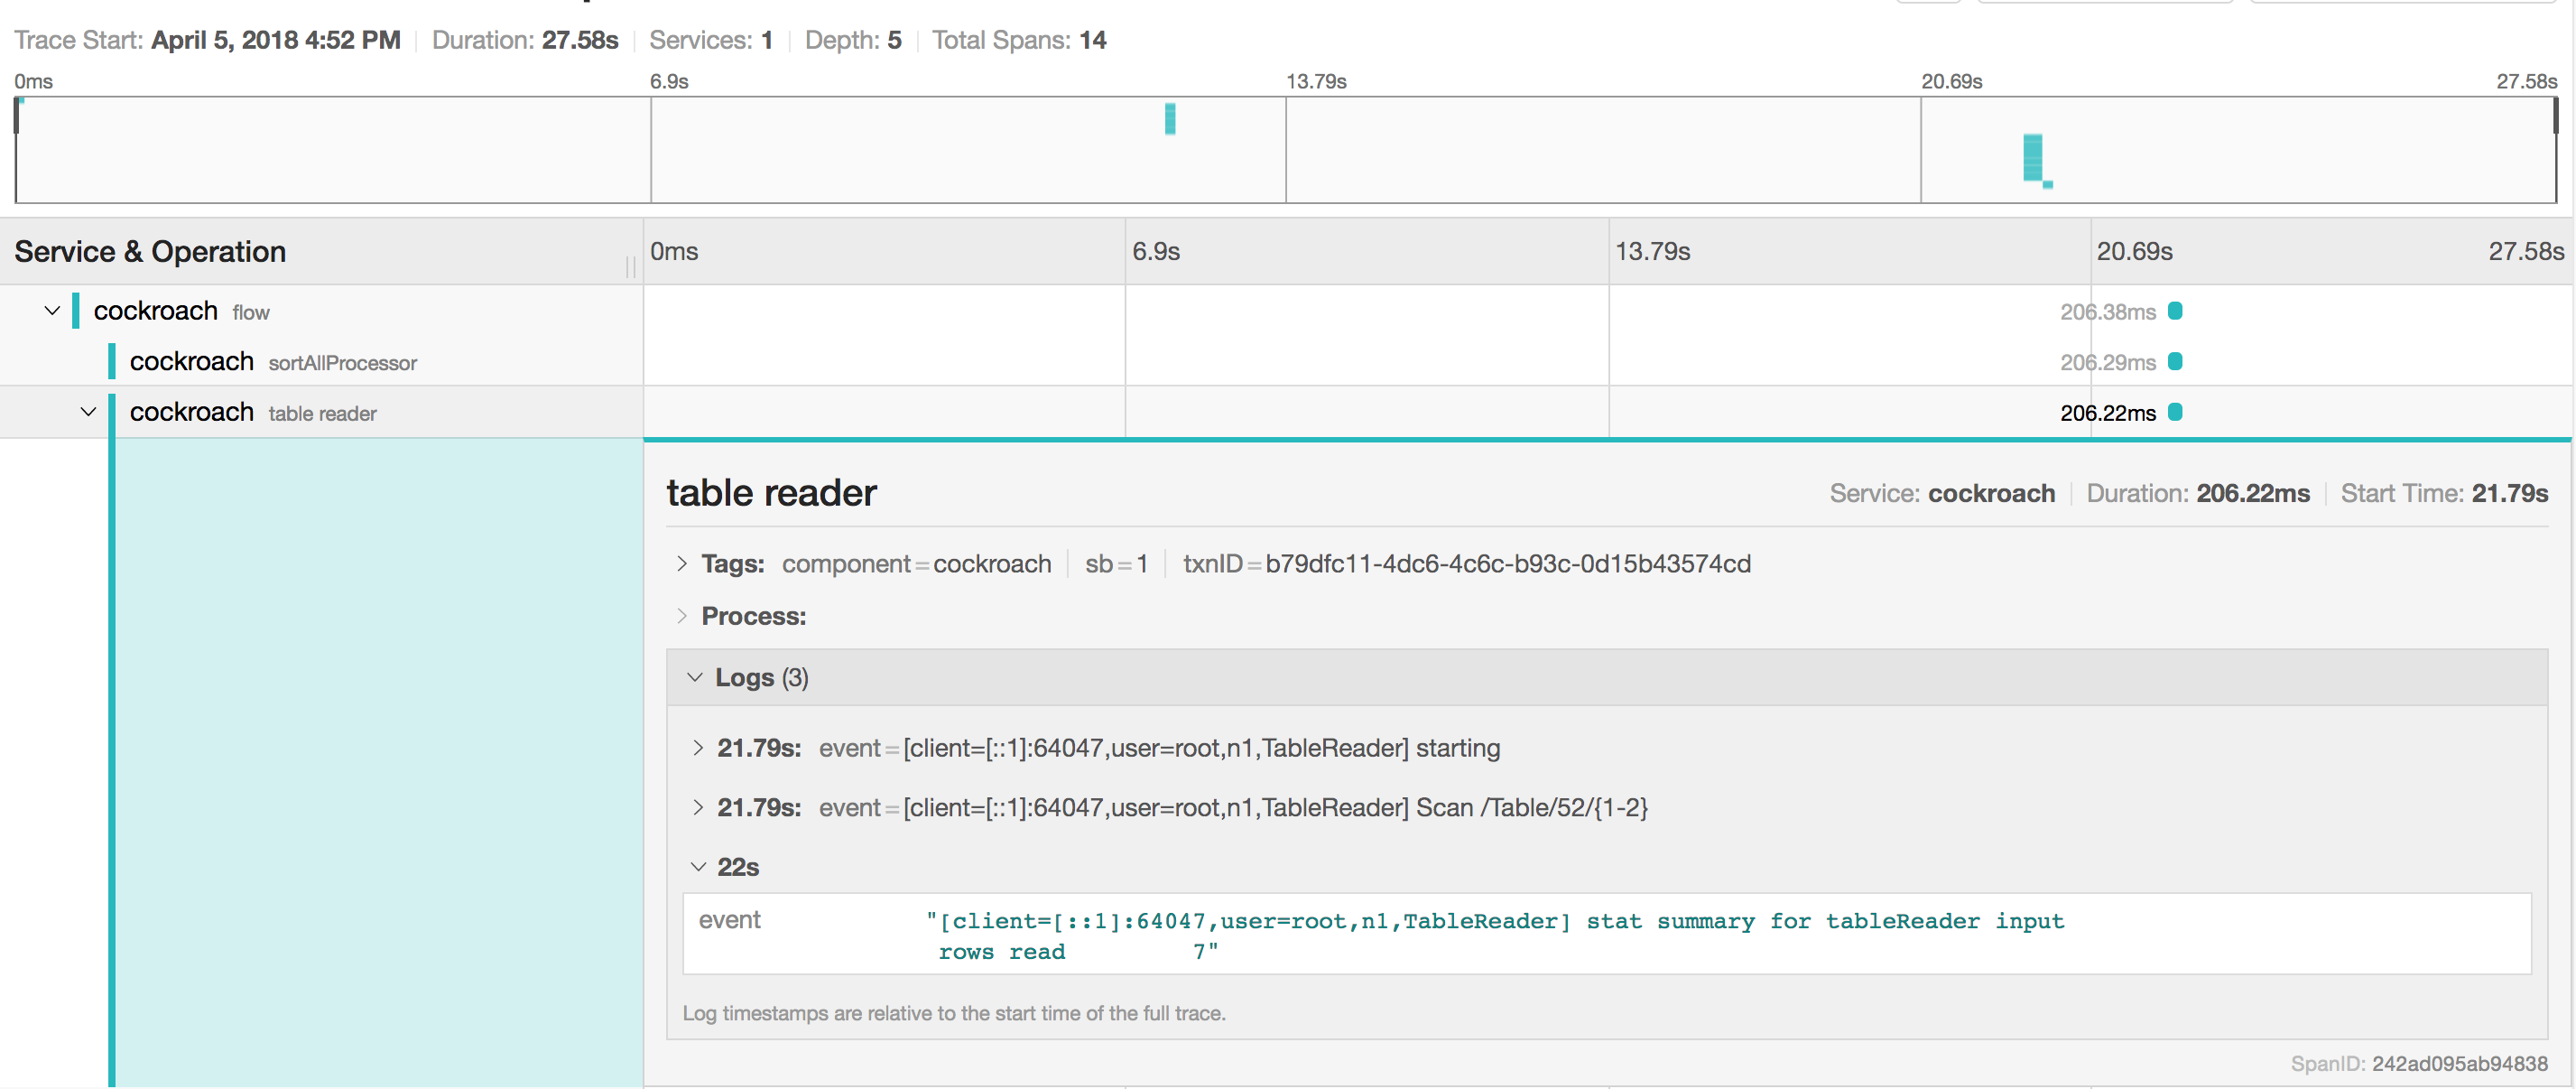
And then through jaeger:
<img width="1427" alt="screen shot 2018-04-05 at 4 53 55 pm" src="https://user-images.githubusercontent.com/10560359/38392141-740ae6d8-38f4-11e8-9406-2c167142eba6.png">
Note that we can't currently run `SHOW TRACE FOR <QUERY>` in distsql mode, which I hope to fix soon (#16562)
Any suggestions to improve the output welcome.
cc @knz @jordanlewis
24715: opt: Fix flaky test r=andy-kimball a=andy-kimball
Update the TestNoMallocs to use the SucceedsSoon method in order
to repeatedly retry until zero memory allocations are detected.
Release note: None
24752: cli: Fix number of args expected by `debug gossip-values` r=a-robinson a=a-robinson
Fixes #24751
Release note: None
It looks like the problem is that my original usage string (`gossip-values <directory>`) was badly copied and pasted from other debug commands, and then assumed necessary by #24399 when in reality no positional argument is used by the command.
Co-authored-by: Alfonso Subiotto Marqués <alfonso@cockroachlabs.com>
Co-authored-by: Andrew Kimball <andyk@cockroachlabs.com>
Co-authored-by: Alex Robinson <alexdwanerobinson@gmail.com>
Build succeeded |
The recent cockroachdb#24529 made a change: it switched to starting the tr's input
using the tr's ctx, instead of the ctx passed to tr.Start(). I think the
change was inadvertent. It diverges from the pattern used by every other
processor that implements RowSource: a proc's ctx is not supposed to be
used by other procs - e.g. it would lead to contradictory logging tags.
In this particular case of the tableReader, perhaps this is not the
worst thing in the world: the tr's input is not a generic rowSource, it
is precisely a RowFetcher (wrapped in layers and layers). So maybe it's
not so bad for the RowFetcher in particular to use a tr's ctx. But now
we've also introduced the InputStatCollector as a possible input, so
we're really pretending that the tr is just like any other proc with an
input. So, I went for uniformity.

Release note: None
24793: distsqlrun: fix tableReader ctx r=andreimatei a=andreimatei

The recent #24529 made a change: it switched to starting the tr's input
using the tr's ctx, instead of the ctx passed to tr.Start(). I think the
change was inadvertent. It diverges from the pattern used by every other
processor that implements RowSource: a proc's ctx is not supposed to be
used by other procs - e.g. it would lead to contradictory logging tags.
In this particular case of the tableReader, perhaps this is not the
worst thing in the world: the tr's input is not a generic rowSource, it
is precisely a RowFetcher (wrapped in layers and layers). So maybe it's
not so bad for the RowFetcher in particular to use a tr's ctx. But now
we've also introduced the InputStatCollector as a possible input, so
we're really pretending that the tr is just like any other proc with an
input. So, I went for uniformity.

Release note: None

Co-authored-by: Andrei Matei <andrei@cockroachlabs.com>
This PR is split into two commits. The first commit lays the groundwork for stat collection code. The stats are modeled as a proto to be sent over the wire in the future (we will be sending these stats as metadata). The second commit modifies the tableReader to use this InputStatCollector to count the number of rows it reads. Example usage:
And then through jaeger:

Note that we can't currently run
SHOW TRACE FOR <QUERY>in distsql mode, which I hope to fix soon (#16562)Any suggestions to improve the output welcome.
cc @knz @jordanlewis