

This module contains a few plotting backends that can be used with SymPy as an alternative to the default Matplotlib backend. A backend represents the plotting library: it provides the necessary functionalities to quickly and easily plot the most common types of symbolic expressions (line plots, surface plots, parametric plots).
The following plotting libraries are supported: Matplolib, Plotly, Bokeh, K3D-Jupyter.


On top of the usual plotting functions exposed by SymPy (plot,
plot_parametric, plot3d, etc.), this module offers the capabily to:
- use a different backend.
- visualize discontinuities on 2D line plots.
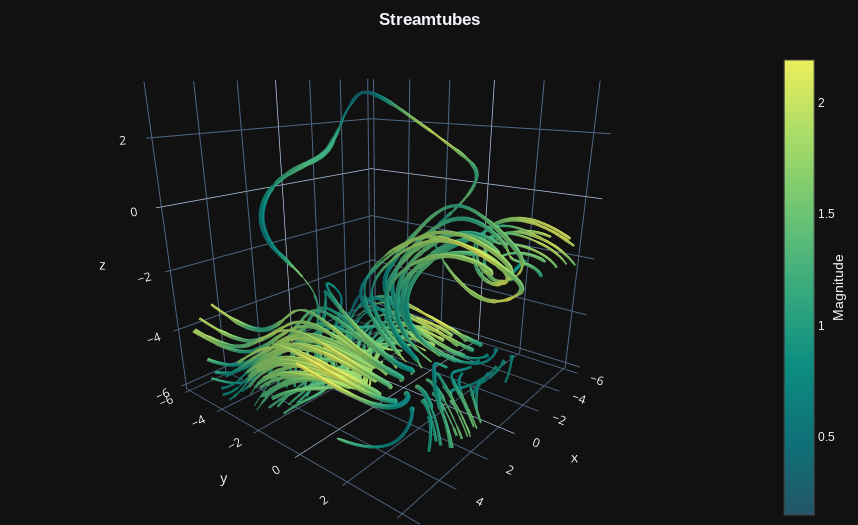
plot_piecewiseto visualize 2D line plots of piecewise functions with their discontinuities.plot_vectorto quickly visualize 2D/3D vector fields with quivers or streamlines.plot_real_imag,plot_complex,plot_complex_list,plot_complex_vectorto visualize complex functions.plot_polarfunction.plot_geometryto quickly visualize entities from thesympy.geometrymodule.iplotfunction to create parametric-interactive plots using widgets (sliders, buttons, etc.).plotgridfunction, which replaces thePlotGridclass: it allows to combine multiple plots into a grid-like layout. It works with Matplotlib, Bokeh and Plotly.
Please, read the
following documentation page
to understand the differences between this module and sympy.plotting.
If you feel like some feature could be implemented, open an issue or create a PR.
To explore the capabilities before the installation, you can:
- Read the documentation,
download this repository and follow the tutorials inside the
tutorialsfolder. - Click the following button to run the tutorials with Binder (note that
Binder is slow to load the module and execute the commands).
The repository is avaliable on PyPi:
pip install sympy_plot_backends
And also on Conda:
conda install -c davide_sd sympy_plot_backends
Some backend comes with a memory cost. Since they require external libraries and/or open a server-process in order to visualize the data, memory usage can quickly rise if we are showing many plots. Keep an eye on you system monitor and act accordingly (close the kernels, restart the browser, etc.).