Improve code performance of chunk handling #624
Description
This is an umbrella issue - I expect to create a number of more specific issues to work through the detail.
"code performance" meaning this issue is not looking at the database.
Starting with this command:
curl -u user:password 'http://my-server/api/prom/api/v1/query_range?step=15&start=1511047800&end=1511047830&query=sum(rate(container_network_tcp_usage_total%5B5m%5D))%20by%20(namespace)'
and with all chunks in cache, we see this:
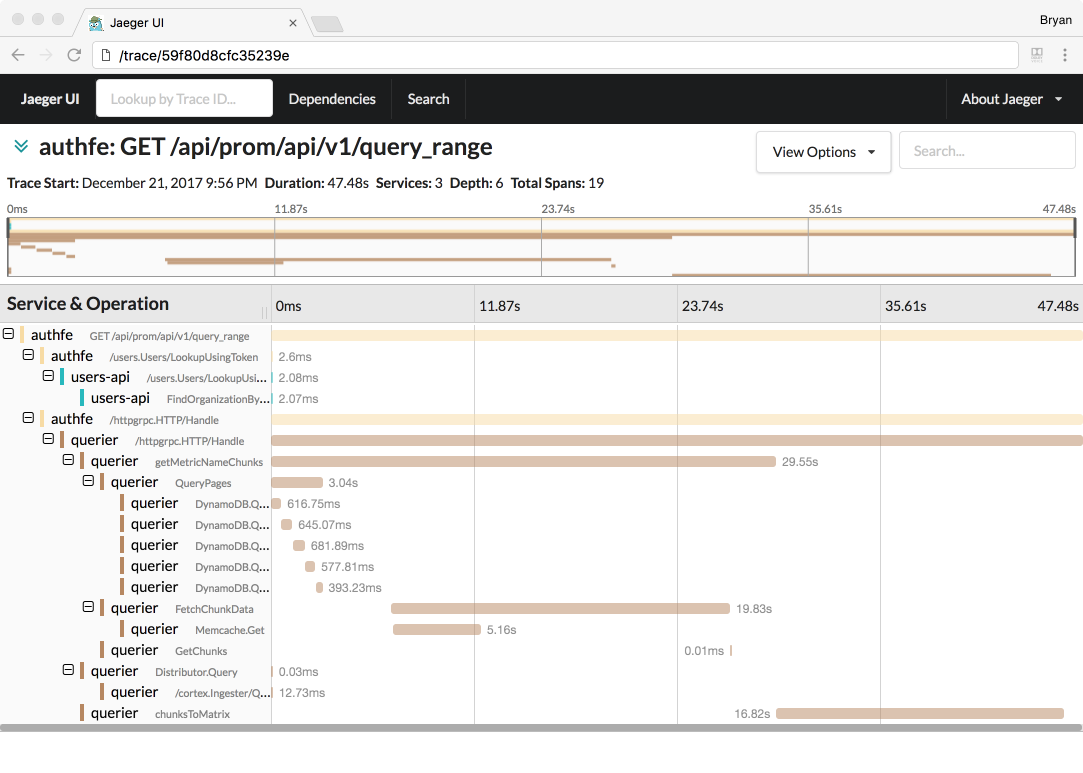
(I've added a couple more spans to make it clearer lots of time is spent decoding chunks from binary and sorting/de-duping them)
Profile CPU:
$ go tool pprof -top -cum samples.cpu.001.pb.gz
11.15s of 19.98s total (55.81%)
Dropped 384 nodes (cum <= 0.10s)
Showing top 80 nodes out of 239 (cum >= 0.55s)
      flat  flat%   sum%        cum   cum%
         0     0%     0%     13.12s 65.67%  github.com/weaveworks/cortex/pkg/chunk.(*Store).Get
         0     0%     0%     13.12s 65.67%  github.com/weaveworks/cortex/pkg/chunk.(*Store).getMetricNameMatrix
         0     0%     0%     13.12s 65.67%  github.com/weaveworks/cortex/pkg/querier.(*chunkQuerier).Query
         0     0%     0%     13.12s 65.67%  github.com/weaveworks/cortex/pkg/querier.mergeQuerier.selectSamplesMatrix.func1
     0.08s   0.4%   0.4%      7.90s 39.54%  runtime.systemstack
         0     0%   0.4%      7.27s 36.39%  github.com/weaveworks/cortex/pkg/chunk.(*Store).getMetricNameChunks
         0     0%   0.4%      5.85s 29.28%  github.com/weaveworks/cortex/pkg/chunk.chunksToMatrix
     0.61s  3.05%  3.45%      4.89s 24.47%  runtime.mallocgc
     0.46s  2.30%  5.76%      4.66s 23.32%  github.com/weaveworks/cortex/pkg/chunk.(*Chunk).Samples
         0     0%  5.76%      4.63s 23.17%  github.com/weaveworks/cortex/pkg/chunk.(*Cache).FetchChunkData
         0     0%  5.76%      4.53s 22.67%  github.com/weaveworks/cortex/pkg/chunk.(*Chunk).Decode
     1.46s  7.31% 13.06%      3.58s 17.92%  runtime.scanobject
         0     0% 13.06%      3.38s 16.92%  runtime.gcBgMarkWorker
         0     0% 13.06%      3.22s 16.12%  runtime.gcBgMarkWorker.func2
     0.02s   0.1% 13.16%      3.22s 16.12%  runtime.gcDrain
     0.04s   0.2% 13.36%      2.75s 13.76%  runtime.makeslice
         0     0% 13.36%      2.72s 13.61%  sort.Sort
     0.49s  2.45% 15.82%      2.71s 13.56%  github.com/weaveworks/cortex/pkg/prom1/storage/local/chunk.(*varbitChunkIterator).Scan
         0     0% 15.82%      2.71s 13.56%  sort.quickSort
     0.08s   0.4% 16.22%      2.62s 13.11%  github.com/weaveworks/cortex/pkg/chunk.(*Chunk).ExternalKey
     2.48s 12.41% 28.63%      2.48s 12.41%  runtime.memclrNoHeapPointers
         0     0% 28.63%      2.43s 12.16%  encoding/json.(*Decoder).Decode
     0.03s  0.15% 28.78%      2.42s 12.11%  github.com/weaveworks/cortex/pkg/chunk.(*ByKey).Less
     0.02s   0.1% 28.88%      2.39s 11.96%  github.com/weaveworks/cortex/pkg/chunk.ByKey.Less
     0.01s  0.05% 28.93%      2.24s 11.21%  runtime.(*mheap).alloc
...
Since this shows garbage collection as a major issue, profile allocations:
$ go tool pprof -alloc_objects -top -cum cmd/querier/querier mem.profile
91068438 of 105219627 total (86.55%)
Dropped 353 nodes (cum <= 526098)
Showing top 80 nodes out of 123 (cum >= 2106135)
      flat  flat%   sum%        cum   cum%
         0     0%     0%   85063816 80.84%  github.com/weaveworks/cortex/pkg/chunk.(*Store).Get
         0     0%     0%   85063816 80.84%  github.com/weaveworks/cortex/pkg/chunk.(*Store).getMetricNameMatrix
         0     0%     0%   85063816 80.84%  github.com/weaveworks/cortex/pkg/querier.(*chunkQuerier).Query
         0     0%     0%   85063816 80.84%  github.com/weaveworks/cortex/pkg/querier.mergeQuerier.selectSamplesMatrix.func1
        17 1.6e-05% 1.6e-05%   81048073 77.03%  github.com/weaveworks/cortex/pkg/chunk.(*Store).getMetricNameChunks
  45679033 43.41% 43.41%   61078016 58.05%  github.com/weaveworks/cortex/pkg/chunk.(*Chunk).ExternalKey
         0     0% 43.41%   56523148 53.72%  github.com/weaveworks/cortex/pkg/chunk.(*ByKey).Less
         0     0% 43.41%   56523148 53.72%  github.com/weaveworks/cortex/pkg/chunk.ByKey.Less
         0     0% 43.41%   56523148 53.72%  sort.Sort
         0     0% 43.41%   56523148 53.72%  sort.quickSort
         0     0% 43.41%   51059033 48.53%  sort.doPivot
    251382  0.24% 43.65%   34120516 32.43%  github.com/weaveworks/cortex/pkg/chunk.(*Store).convertIndexEntriesToChunks
         0     0% 43.65%   31945492 30.36%  github.com/weaveworks/cortex/pkg/chunk.(*Store).lookupChunksByMetricName
      3125 0.003% 43.65%   23400990 22.24%  github.com/weaveworks/cortex/pkg/chunk.(*Cache).FetchChunkData
   1818786  1.73% 45.38%   22562147 21.44%  github.com/weaveworks/cortex/pkg/chunk.(*Chunk).Decode
         0     0% 45.38%   19784133 18.80%  encoding/json.(*decodeState).unmarshal
         0     0% 45.38%   19784133 18.80%  encoding/json.(*decodeState).value
   3227746  3.07% 48.45%   19456448 18.49%  encoding/json.(*decodeState).object
         0     0% 48.45%   17958958 17.07%  encoding/json.(*Decoder).Decode
  15398983 14.64% 63.09%   15401714 14.64%  fmt.Sprintf
...