![]()
A high-performance network logging server that receives log messages over TCP or UDP and writes them to files with automatic rotation. Built with Rust and Tokio for async I/O.
Jon Listen is a network logging server that:
- Receives logs from applications over TCP or UDP
- Writes logs to plain text files with automatic rotation
- Provides metrics via Prometheus endpoint for monitoring
- Handles backpressure with configurable policies (block or discard)
- Supports high concurrency with async/await architecture
Perfect for centralized logging, log aggregation, or as a simple log sink for distributed systems.
- Protocol Support: TCP and UDP server modes
- File Rotation: Automatic rotation by day or duration with configurable retention
- Backpressure Handling: Configurable policies (Block or Discard) when buffers are full
- Connection Limits: Configurable maximum concurrent TCP connections (default: 1000)
- Prometheus Metrics: Built-in metrics endpoint for monitoring (default port: 9090)
- Graceful Shutdown: Clean shutdown on SIGTERM/SIGINT
- Environment Configuration: Override settings via environment variables
- Async Architecture: Built on Tokio for high-performance async I/O
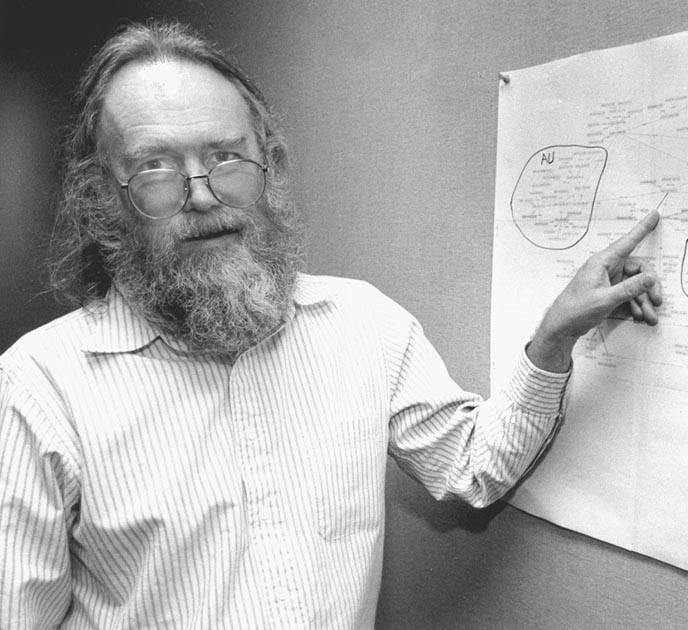
Jon Postel in 1994, with map of Internet top-level domains.
- Rust stable (Edition 2021)
rustup install stable
rustup default stable- Start the server:
RUST_LOG=info cargo runThe server will start listening on the configured host and port (default: 0.0.0.0:8080). It will write received messages to log files in the configured directory.
- Send logs (using the example client):
# UDP
cargo run --example logging_client -- --address 127.0.0.1:8080 --duration 10

# TCP
cargo run --example logging_client -- --address 127.0.0.1:8080 --duration 10 --tcp- View metrics (if metrics are enabled):
curl http://localhost:9090/metrics- Stop the server: Press Ctrl+C for graceful shutdown.
Configuration is written in TOML format. The default configuration is in config/default.toml.
Jon Listen loads configuration in this order (later values override earlier ones):
config/default.toml(required)config/{RUN_MODE}.toml(optional, e.g.,config/development.tomlorconfig/production.toml)config/local.toml(optional, for local overrides)- Environment variables with
APP_prefix
Set RUN_MODE environment variable to load environment-specific config:
RUN_MODE=production cargo run- Server: Protocol (TCP/UDP), host, port, max connections
- File Writer: Directory, filename, rotation policy, backpressure policy
- Rotation: Policy (ByDay/ByDuration), retention count, duration
- Metrics: Prometheus metrics port (default: 9090)
Log Level: Control application logging with RUST_LOG:
RUST_LOG=info cargo run                    # Set global log level
RUST_LOG=writer=debug cargo run            # Set per-module log level
Configuration Overrides: Override any config value using APP_ prefix:
# Override rotation policy
APP_filewriter_rotation_policy=ByDuration cargo run

# Override server port
APP_server_port=9000 cargo run

# Override multiple settings
RUST_LOG=info APP_server_port=9000 APP_filewriter_rotation_policy=ByDay cargo run
The environment variable naming follows the TOML structure: APP_{section}_{key} or APP_{section}_{subsection}_{key}.
Execute from the terminal:
cargo testFor test statistics summary, use cargo-nextest:
cargo install cargo-nextest
cargo nextest runGenerate a coverage report:
./scripts/coverage.shThis will:
- Install
cargo-tarpaulinif not already installed - Generate an HTML coverage report in
./coverage/tarpaulin-report.html - Display a coverage summary in the terminal
Open ./coverage/tarpaulin-report.html in your browser to view detailed line-by-line coverage.
Simple UDP sender (sends N messages):
cargo run --example send_via_udp -- 127.0.0.1:8080 1000Minimal logging client (UDP or TCP) for a duration:
cargo run --example logging_client -- --address 127.0.0.1:8080 --duration 10
cargo run --example logging_client -- --address 127.0.0.1:8080 --duration 10 --tcpApache-2.0