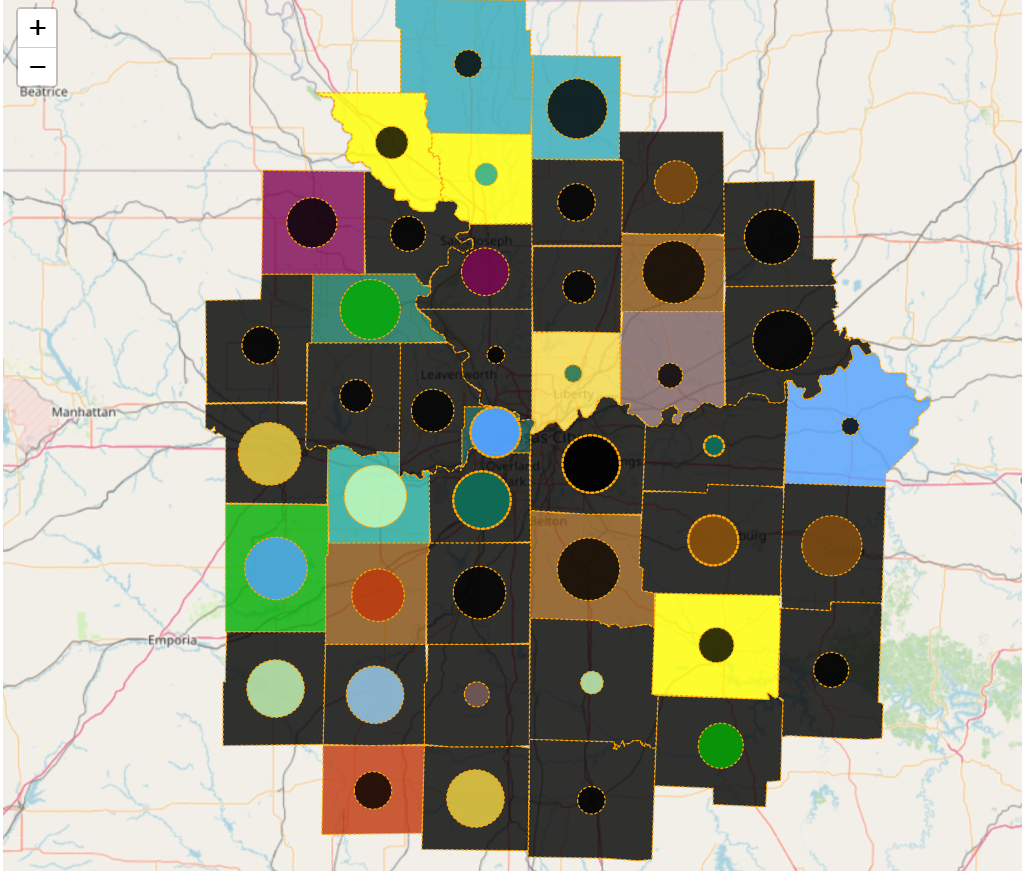
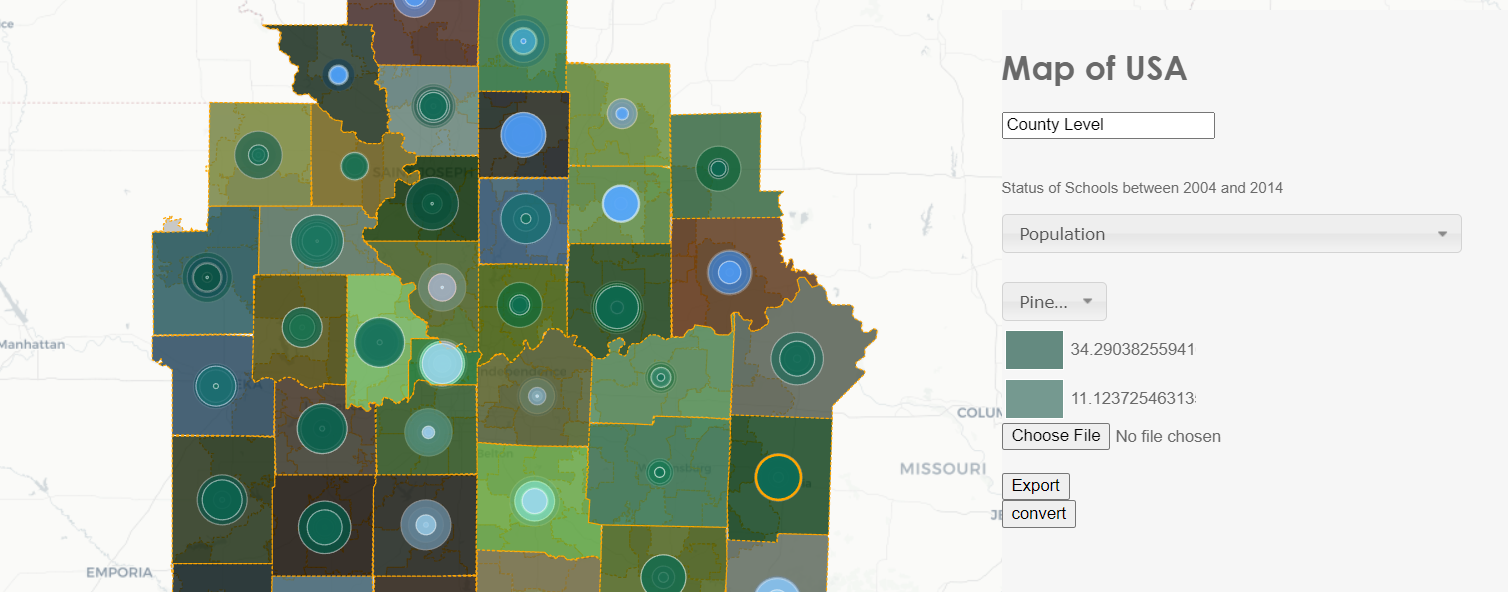
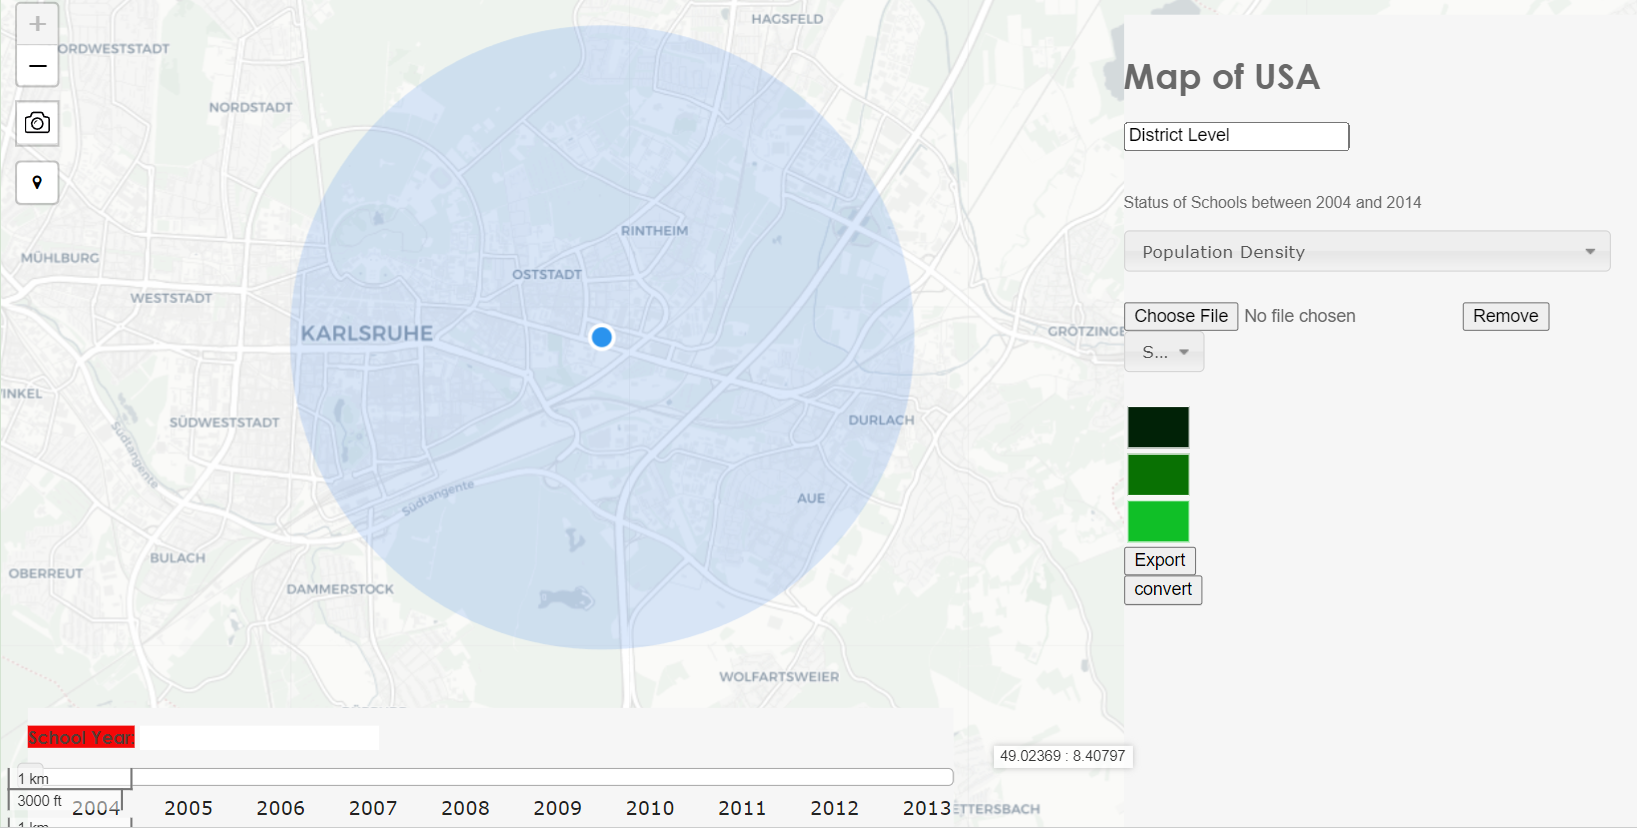
tutorial_US_map creating a choropleth map and Proportional Symbol Map tutorial adding a slider to visualize result year wise adding dropdown and visualize data on select menu Click layer to see its data in dashboard and export that layer to GeoJson or add the data to txt file add legend and value in the dashboard add echarts library to display the data in a chart geolocation and screenshot to geolocate and make a map screenshots