The ZoomTool doesn't work well with the BroadcasterTool and multiple axis in a Plot. Running the multiaxis_using_Plot.py example, and zooming in a certain range leads to a new plot with the regular axis has the correct range but not the secondary axis.
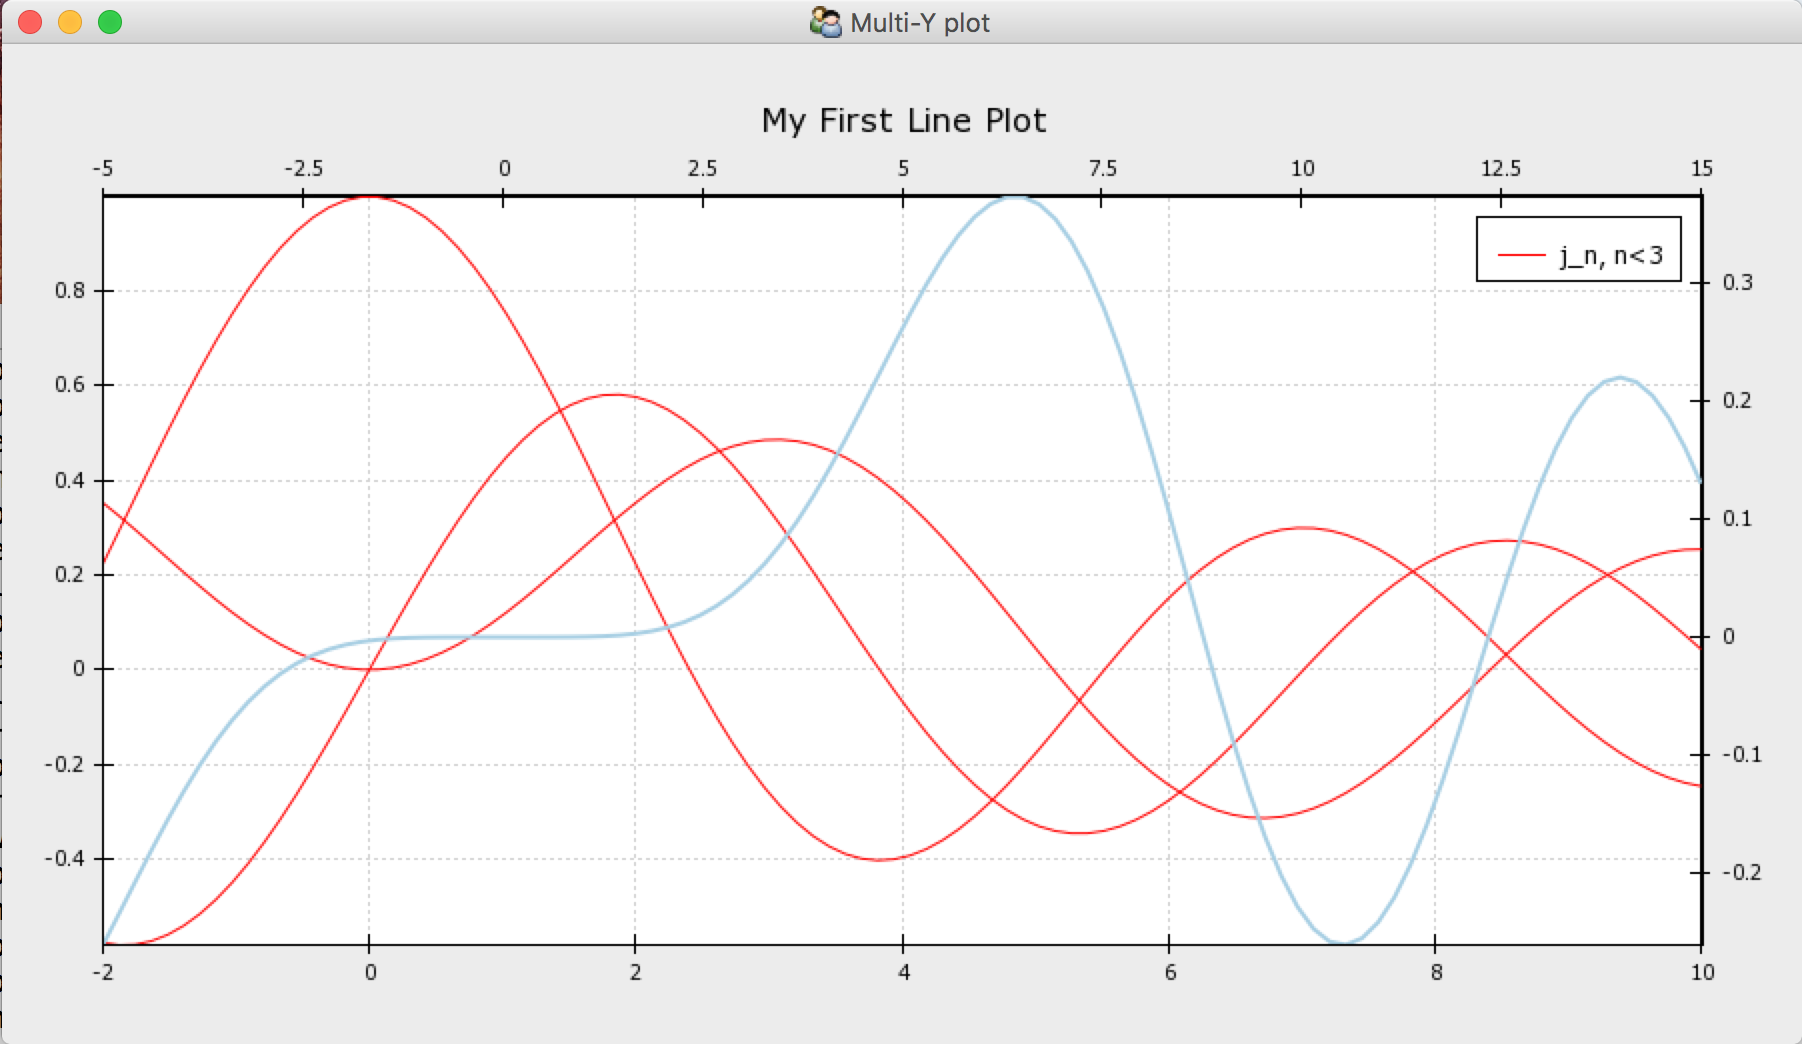
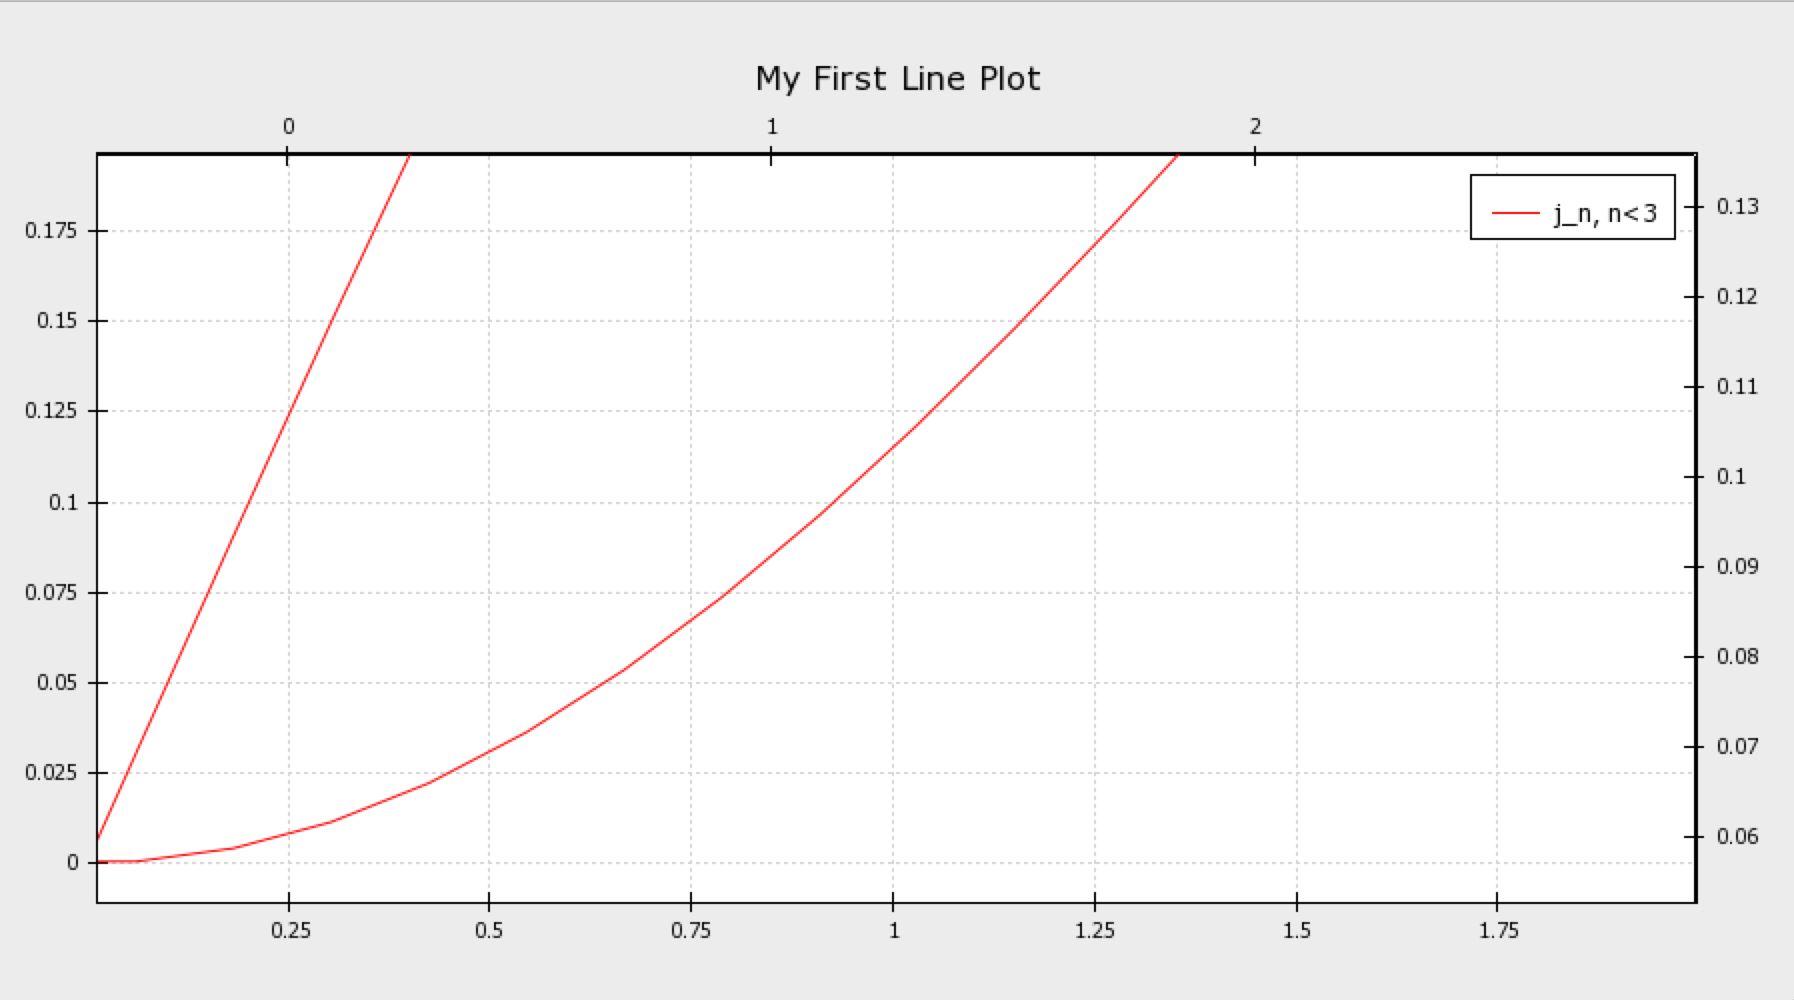
From the full plot, if I zoom say from (0, 0) to (2, 0.2), the y-axis range should roughly be [-0.05, 0.05]. Instead I get the following:
The ZoomTool doesn't work well with the
BroadcasterTooland multiple axis in a Plot. Running themultiaxis_using_Plot.pyexample, and zooming in a certain range leads to a new plot with the regular axis has the correct range but not the secondary axis.From the full plot, if I zoom say from (0, 0) to (2, 0.2), the y-axis range should roughly be [-0.05, 0.05]. Instead I get the following: