Enable recall/percentile latency charts on results#300
Enable recall/percentile latency charts on results#300maumueller merged 2 commits intoerikbern:masterfrom
Conversation
|
Thanks! Some general observations:
|
|
WRT:
I missed that. will do the change 👍 WRT:
It will work, and for this case ( small number of total observations ) it might not compensate to use a sketching DS given as you mentioned above you already preserve all latencies. It makes sense to use the hdrhistogram or any other approximate computation sketch when you don't want to keep the entire data. Given the entire data is kept no reason to use it. Will swap to numpy.percentile over the times group. |
|
Thanks! |
51d412c to
0cdb68b
Compare
aa43352 to
d3dc75d
Compare
@maumueller I've updated the PR based upon your recommendations. Ready for review =) |
|
Interesting change! Do you have results for this? My guess would be that you don't have the power-law type fat-tailed latencies you typically see in distributed systems, but that the tails are fairly thin. But I could be wrong! |
Given long tails might be related to resource saturation, queuing, etc... I believe we will still see longtails -- and there is no harm there :). However, one favorable thing I think we will avoid is the multi-modal latencies distribution given we're targeting the same type of operations, etc...
|
CP for erikbern#300: Enable recall/latency charts on results
|
Sorry, @filipecosta90, I lost track of it. PR looks good and I merged it. Thanks for the contribution. |
* Enable recall/latency charts on results

* Fixes per PR review
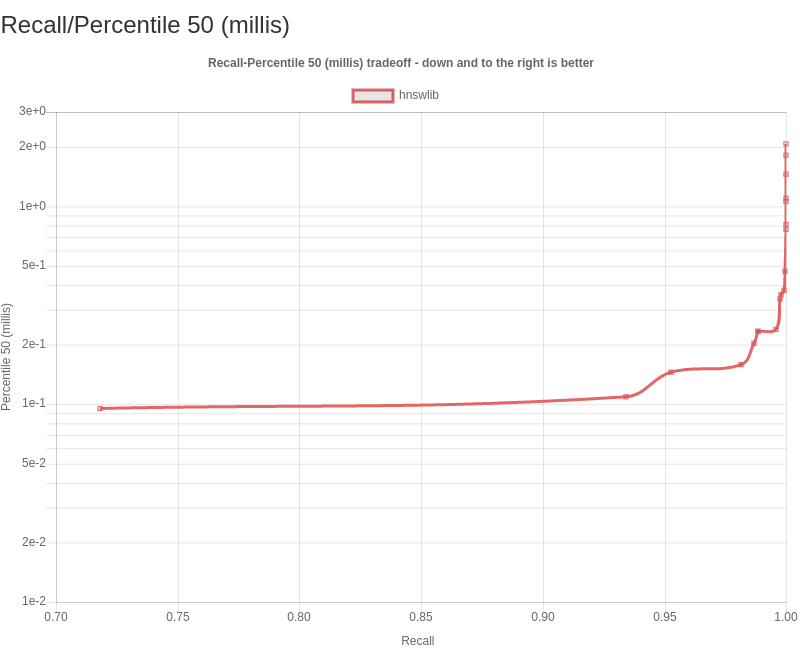
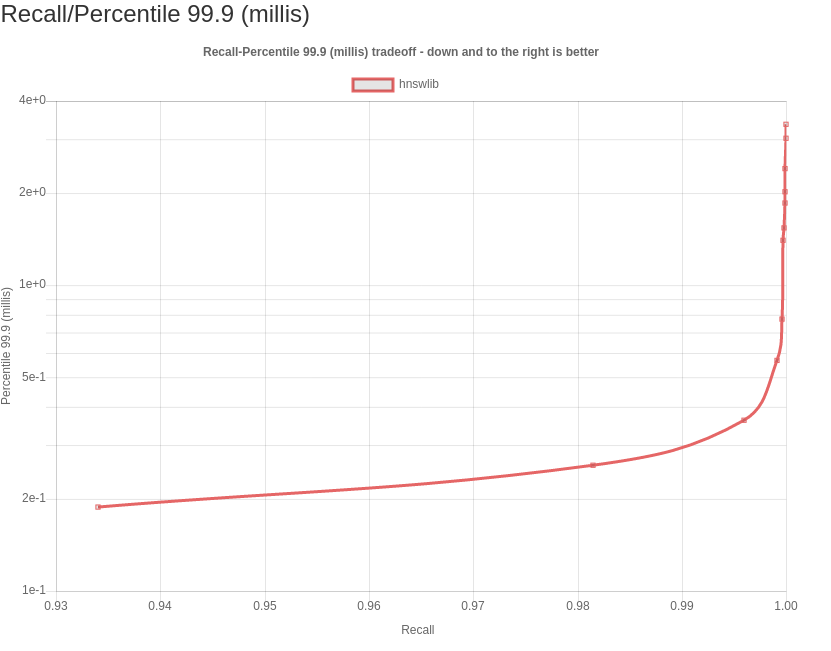
The following PR enables latency by percentile analysis for a set of common percentiles on the generated results website: p50, p95, p99, and p999 -- i.e. the median and and tail latencies. In other words, They are the latency thresholds at which 50%, 95%, 99%, and 99.9% of queries are faster than that particular presented value.
latency and qps analysis -- and why we need both
For distributions that are non-normal, such as the latency, many “basic rules” of normally distributed statistics are violated. Instead of computing just the mean (or a single number which is the inverse related toqps), which tries to express the whole distribution in a single result, we can use a sampling of the distribution at intervals -- percentiles, which tell you how many requests actually would experience that delay.
Further notes
I believe that as soon as this benchmark utility allows for extended latency tracking/analysis, further questions/requests will arise -- for example allowing for constant throughput benchmarks ( but first things first ).
If you want to dive deeper on extended latency analysis here's a list of further references for documentation, projects and presentations diving deeper in the discussed subject: