Check weather.py plots #86
Description
When testing weather.py with the new input data (#85) I noticed some problems with the app:
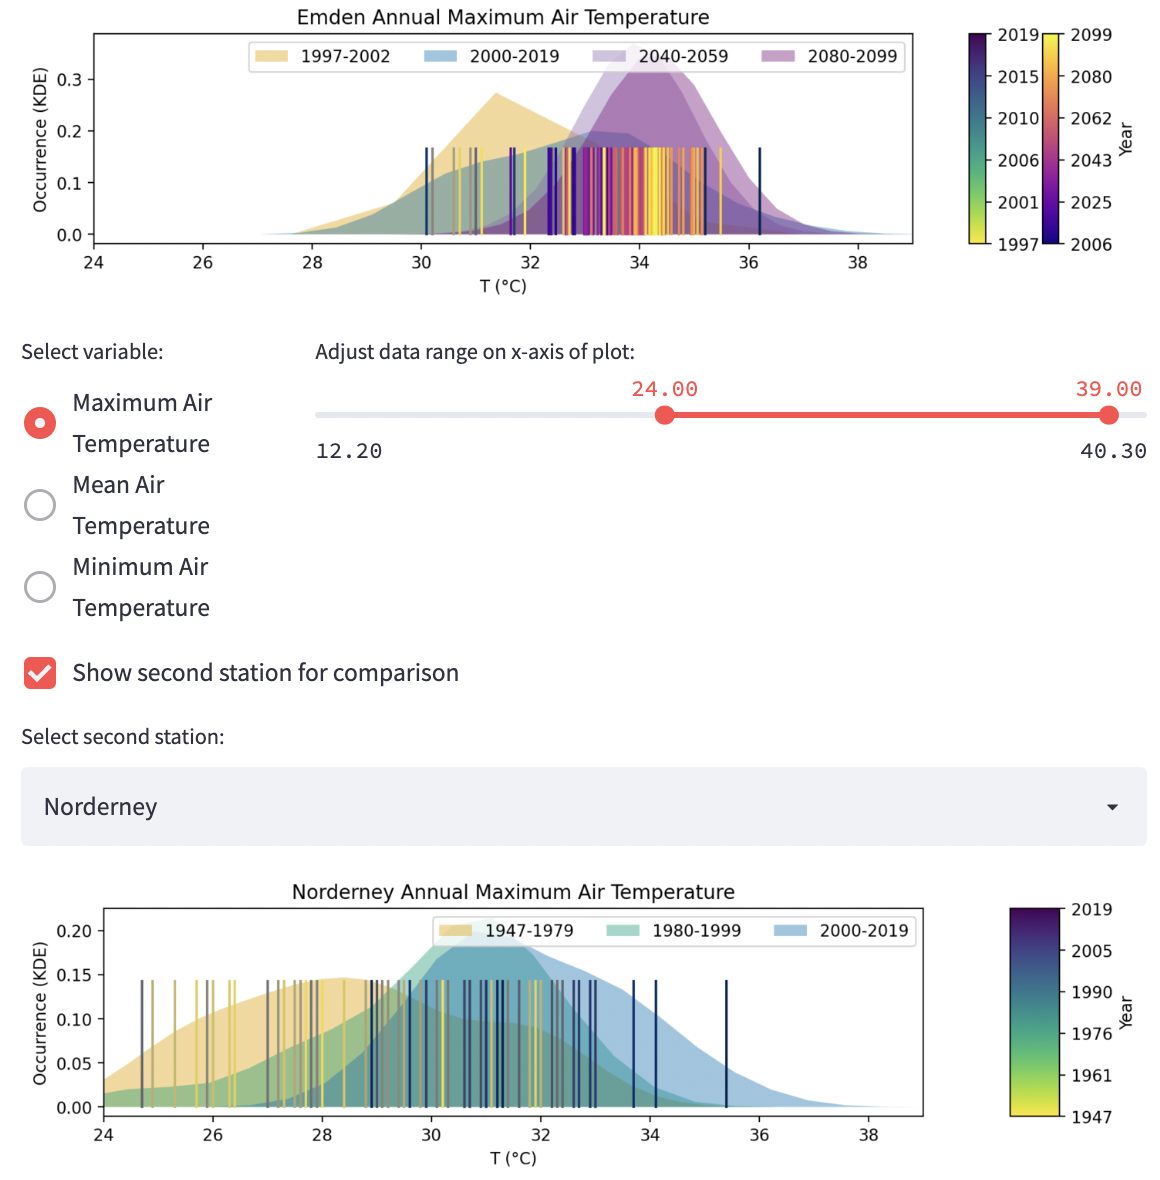
- annually aggregated plot: RCPs / climate projections are not shown in the second plot:
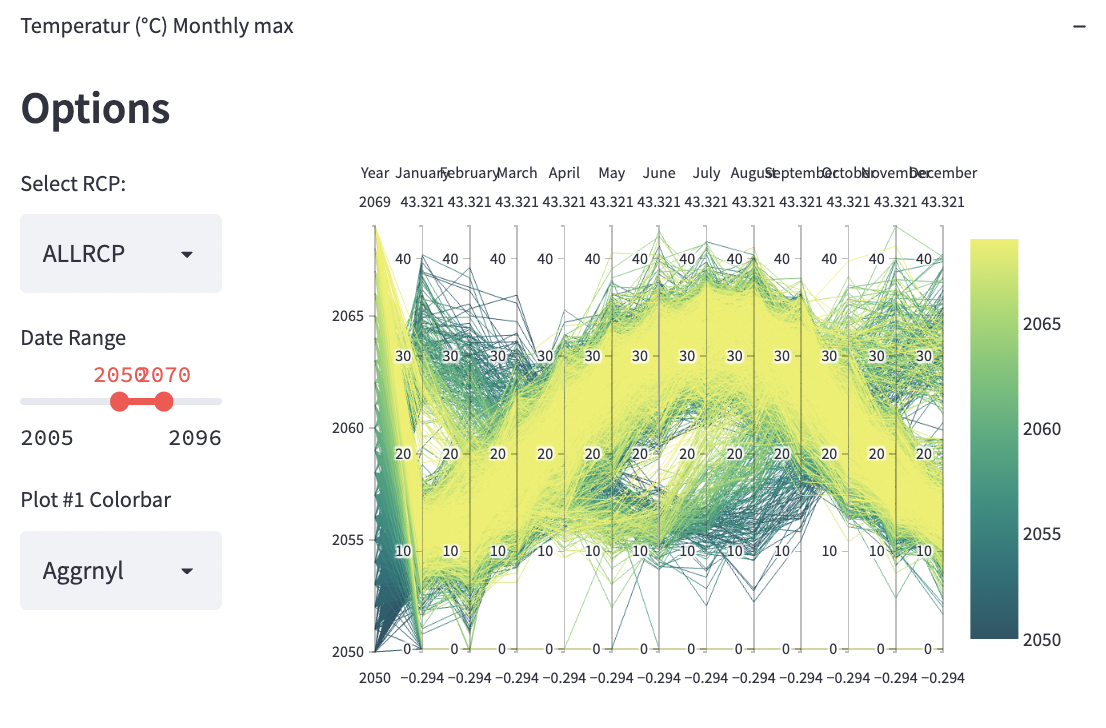
- parallel coordinates plot: some of the projections still seem off with lowest temperatures occurring during summer months:
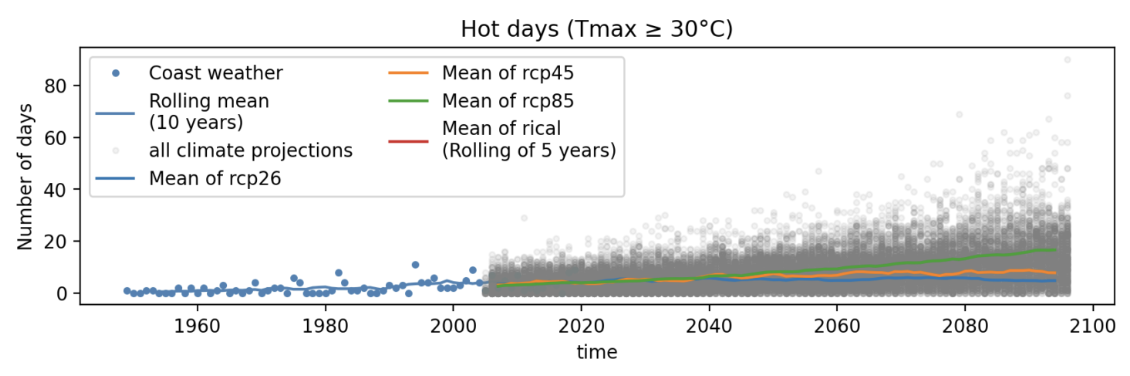
- climate indices plot: before climate indices plot is shown, the user has to select a RCP. This is not necessary, as all RCPs are always shown in the plot, selecting a different RCP does not change anything. Additionally, selecting
Continue without climate projectionsbreaks the app.
Furthermore, the red lineMean of ricalis not shown in the plot: