Conversation
First implementation of the bubble plot as an extra app closely following Jonas' implementation.
|
And btw, I found a way to fix the percentage numbers. Maybe the most over-engineered piece of code I ever wrote :) |
Codecov Report
@@            Coverage Diff             @@
##             main      #87      +/-   ##
==========================================
- Coverage   19.05%   18.07%   -0.99%
==========================================
  Files          22       25       +3
  Lines        1926     2053     +127
==========================================
+ Hits          367      371       +4
- Misses       1559     1682     +123
Continue to review full report at Codecov.
|
 AlexDo1
left a comment
AlexDo1
left a comment
There was a problem hiding this comment.
I really like the new sunburst plot, everything works perfectly.
I just think we need a more detailed explanation of the plot for the final version.
Great that you managed to display the percentages, I just found a small bug with the hovertext display in the innermost circle:
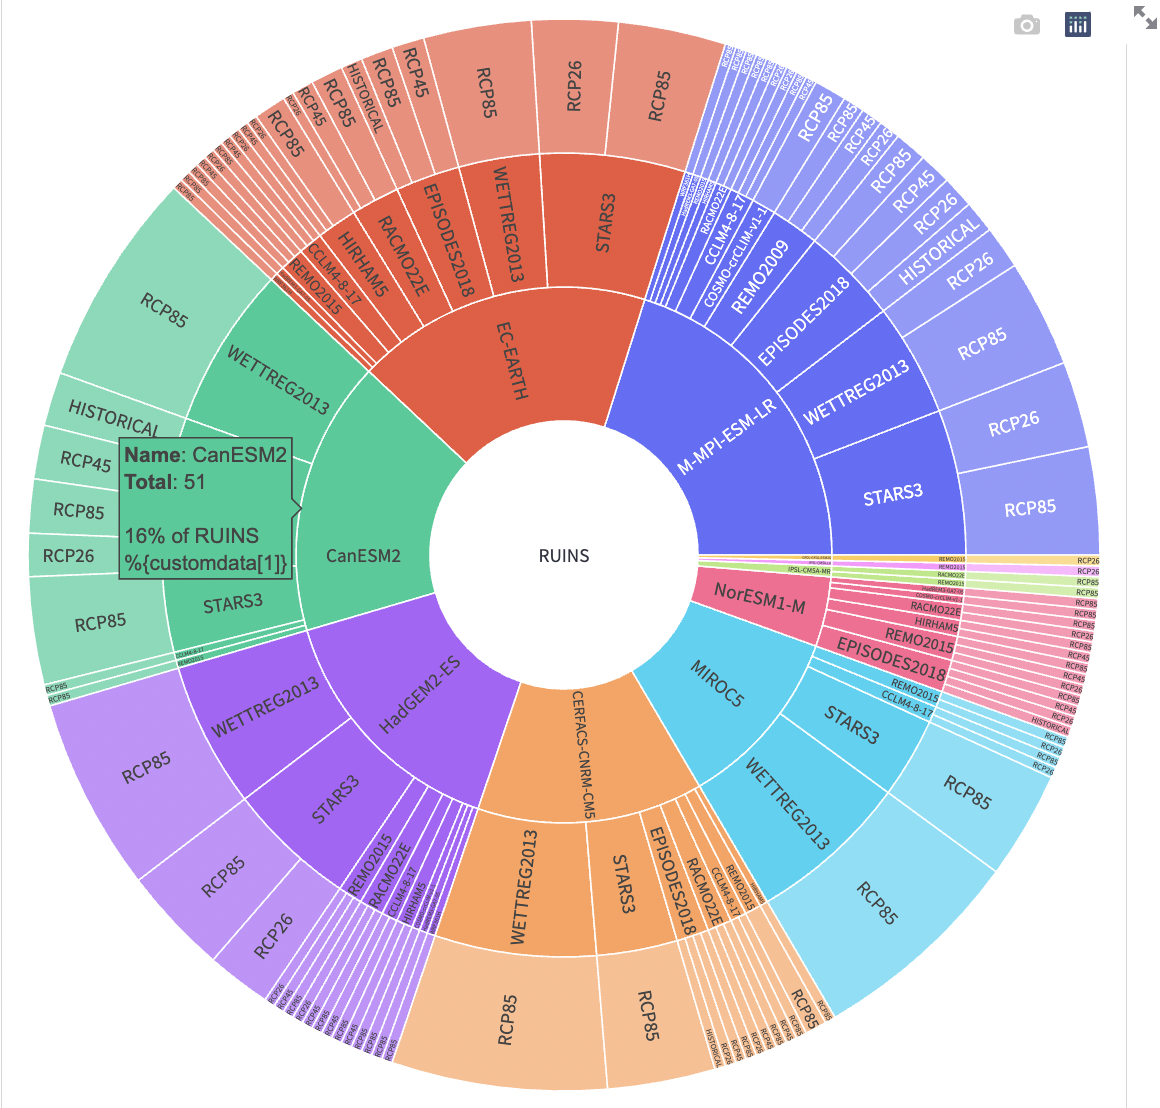
The hovertext of the other circles looks good and does not show {customdata[1]}
|
I think the problem was, that these labels were empty ( due to missing parent category). Now, I added a |
|
One more problem I just encountered:
|
|
Yeah, I don't have a good idea how we can come around this so far. The page might change anyway, so I would postpone this |
|
Okay, then we can merge in my opinion, the plot looks good. |
@AlexDo1,
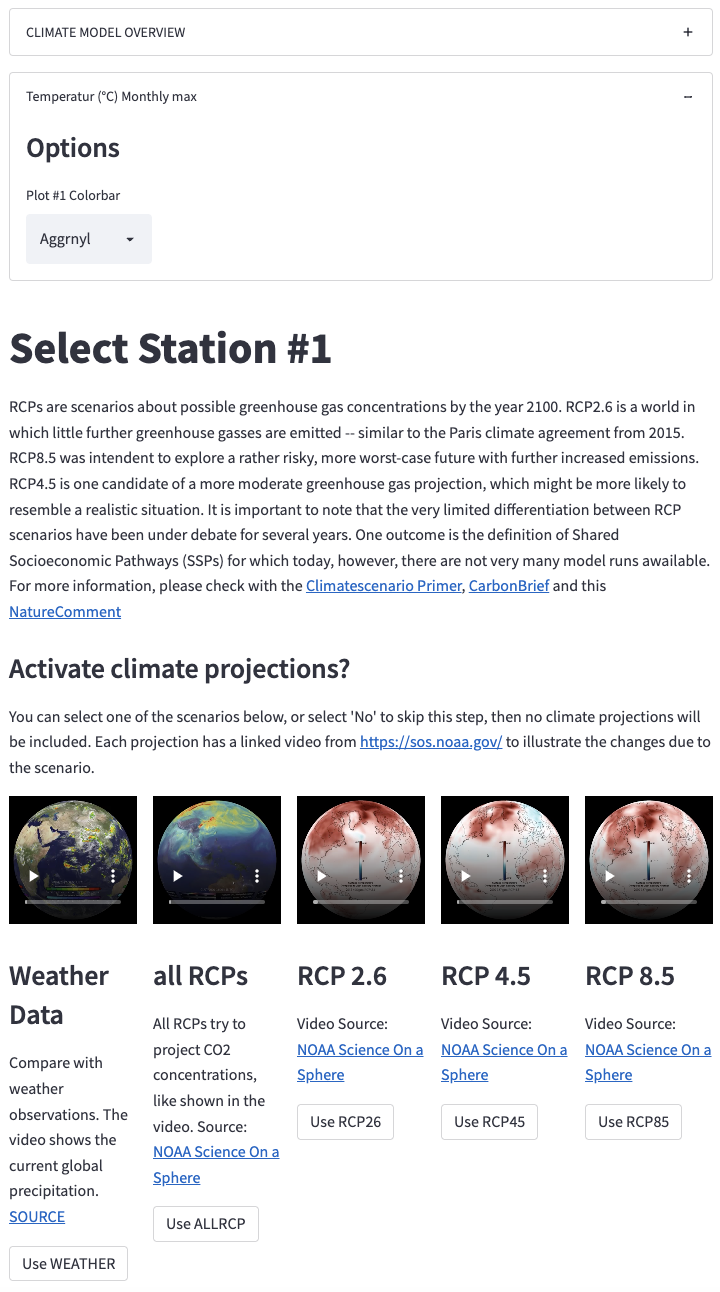
I implemented the sunburst plot into your bubble_plot branch. The plot is shown on the trasition page from weather explorer to climate explorer, and in the climate explorer itself.
The infobox still needs translation and a better text. That's something for later.
Please review the stuff and, if you like it, we can get rid of the bubble plot routine before merging into the main branch.