Hi, I suggest to add an option to annotate the points on the Gibbs diagram. such as: ax1.annotate(df.at[i, 'Sample'], (x, y), fontsize=6) 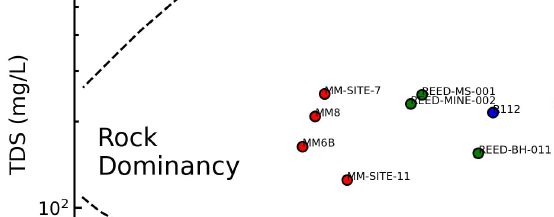
Hi, I suggest to add an option to annotate the points on the Gibbs diagram.
such as: ax1.annotate(df.at[i, 'Sample'], (x, y), fontsize=6)