Skip to content

Add benchmarking for the http tracing handler#2080

Merged
knative-prow-robot merged 3 commits into
knative:mainfrom
skonto:benchmark-tracing
Apr 8, 2021
Merged

Add benchmarking for the http tracing handler#2080
knative-prow-robot merged 3 commits into
knative:mainfrom
skonto:benchmark-tracing

Conversation

@skonto
Copy link
Copy Markdown
Contributor

@skonto skonto commented Apr 1, 2021

  • Adds a benchmark to be used as a baseline for future changes or migrations. This is helpful especially because tracing happens in several places like activator, queue-proxy. Note that eventing uses direct calls to opencesus lib eg. trace.StartSpan() in its event handlers and sets span attributes explicitly in several occasions (this is lighter compared to the handler we benchmark here). I am wondering if we can do the same for Serving as trace.StartSpan() is run anyway as part of the HTTPSpanMiddleware (worth investigating next and use this benchmark to compare changes). Maybe create an optimized handler to be used with activator, queue-proxy?
    Allocations btw seem to be pretty high check bellow. /cc @evankanderson
$ go test   -benchmem -memprofile memprofile.out -cpuprofile profile.out -test.v -test.bench BenchmarkSpanMiddleware -test.run ^$ ./tracing/
goos: linux
goarch: amd64
pkg: knative.dev/pkg/tracing
BenchmarkSpanMiddleware
BenchmarkSpanMiddleware/sequential
BenchmarkSpanMiddleware/sequential-12         	  133786	      9358 ns/op	    6718 B/op	      97 allocs/op
BenchmarkSpanMiddleware/parallel
BenchmarkSpanMiddleware/parallel-12           	  300289	      4129 ns/op	    6586 B/op	      97 allocs/op
PASS
ok  	knative.dev/pkg/tracing	3.025s

From sequential execution:

Dropped 76 nodes (cum <= 12.05ms)
Showing top 10 nodes out of 142
      flat  flat%   sum%        cum   cum%
     480ms 19.92% 19.92%      910ms 37.76%  runtime.scanobject
     190ms  7.88% 27.80%      190ms  7.88%  runtime.procyield
     160ms  6.64% 34.44%      240ms  9.96%  runtime.findObject
     130ms  5.39% 39.83%      400ms 16.60%  runtime.mallocgc
     110ms  4.56% 44.40%      110ms  4.56%  runtime.pageIndexOf (inline)
      70ms  2.90% 47.30%       70ms  2.90%  runtime.memclrNoHeapPointers
      60ms  2.49% 49.79%       60ms  2.49%  runtime.memmove
      60ms  2.49% 52.28%       70ms  2.90%  runtime.spanOf
      50ms  2.07% 54.36%      170ms  7.05%  runtime.greyobject
      50ms  2.07% 56.43%       80ms  3.32%  runtime.heapBitsSetType

It means that for the most part there is gc work going on here. Let's check gc allocation:

Dropped 11 nodes (cum <= 63402)
Showing top 10 nodes out of 75
      flat  flat%   sum%        cum   cum%
   1327148 10.47% 10.47%    1327148 10.47%  go.opencensus.io/tag.Upsert
    819212  6.46% 16.93%    2306801 18.19%  go.opencensus.io/trace.(*span).copyToCappedAttributes
    699082  5.51% 22.44%     699082  5.51%  container/list.(*List).insertValue (inline)
    654138  5.16% 27.60%    1353220 10.67%  github.com/golang/groupcache/lru.(*Cache).Add
    546149  4.31% 31.90%    1043150  8.23%  go.opencensus.io/trace.newLruMap
    524333  4.13% 36.04%     622638  4.91%  contrib.go.opencensus.io/exporter/zipkin.zipkinSpan
    466960  3.68% 39.72%    1618794 12.77%  go.opencensus.io/plugin/ochttp.(*trackingResponseWriter).end.func1
    447849  3.53% 43.25%     447849  3.53%  context.WithValue
    400255  3.16% 46.41%    2726550 21.50%  go.opencensus.io/plugin/ochttp.(*Handler).startStats
    382302  3.01% 49.43%     382302  3.01%  go.opencensus.io/tag.newMap (inline)

By digging into startStats I see that similar to the findings in metrics benchmarking, mutators and other tag/attributes manipulation cause significant overhead.

@google-cla google-cla Bot added the cla: yes Indicates the PR's author has signed the CLA. label Apr 1, 2021
@knative-prow-robot knative-prow-robot added the size/M Denotes a PR that changes 30-99 lines, ignoring generated files. label Apr 1, 2021
@skonto skonto changed the title Add benchmark for tracing handler Add a benchmark for tracing handler Apr 1, 2021
@skonto skonto changed the title Add a benchmark for tracing handler Add benchmarking for the http tracing handler Apr 1, 2021
@codecov
Copy link
Copy Markdown

codecov Bot commented Apr 1, 2021

Codecov Report

Merging #2080 (934c5de) into main (952fdd9) will decrease coverage by 0.07%.
The diff coverage is n/a.

❗ Current head 934c5de differs from pull request most recent head d78d372. Consider uploading reports for the commit d78d372 to get more accurate results
Impacted file tree graph

@@            Coverage Diff             @@
##             main    #2080      +/-   ##
==========================================
- Coverage   67.36%   67.29%   -0.08%     
==========================================
  Files         215      215              
  Lines        9111     9091      -20     
==========================================
- Hits         6138     6118      -20     
  Misses       2698     2698              
  Partials      275      275              
Impacted Files Coverage Δ
reconciler/filter.go 100.00% <0.00%> (ø)

Continue to review full report at Codecov.

Legend - Click here to learn more
Δ = absolute <relative> (impact), ø = not affected, ? = missing data
Powered by Codecov. Last update 952fdd9...d78d372. Read the comment docs.

@markusthoemmes
Copy link
Copy Markdown
Contributor

I am wondering if we can do the same for Serving as trace.StartSpan() is run anyway as part of the HTTPSpanMiddleware (worth investigating next and use this benchmark to compare changes). Maybe create an optimized handler to be used with activator, queue-proxy?

Both the activator and the queue-proxy already do this, so I'd be curious what we're even getting from this handler.

Copy link
Copy Markdown
Contributor

@markusthoemmes markusthoemmes left a comment

Choose a reason for hiding this comment

The reason will be displayed to describe this comment to others. Learn more.

I'd love to understand what this handler even does for us. Even if disabled, it causes quite a bit of overhead, see knative/serving#11016.

We're already manually adding traces in both the activator and the queue-proxy so... does this even add any value?

Comment thread tracing/http_test.go Outdated

fw := &fakeWriter{}

req, err := http.NewRequest("GET", "http://test.example.com", nil)
Copy link
Copy Markdown
Contributor

Choose a reason for hiding this comment

The reason will be displayed to describe this comment to others. Learn more.

nit

Suggested change
req, err := http.NewRequest("GET", "http://test.example.com", nil)
req, err := http.NewRequest(http.MethodGet, "http://test.example.com", nil)

Comment thread tracing/http_test.go Outdated
next := testHandler{}
middleware := HTTPSpanMiddleware(&next)

fw := &fakeWriter{}
Copy link
Copy Markdown
Contributor

Choose a reason for hiding this comment

The reason will be displayed to describe this comment to others. Learn more.

Is anything ever calling Write on this? That function would cause additional allocations I believe if called.

Copy link
Copy Markdown
Contributor Author

@skonto skonto Apr 1, 2021

Choose a reason for hiding this comment

The reason will be displayed to describe this comment to others. Learn more.

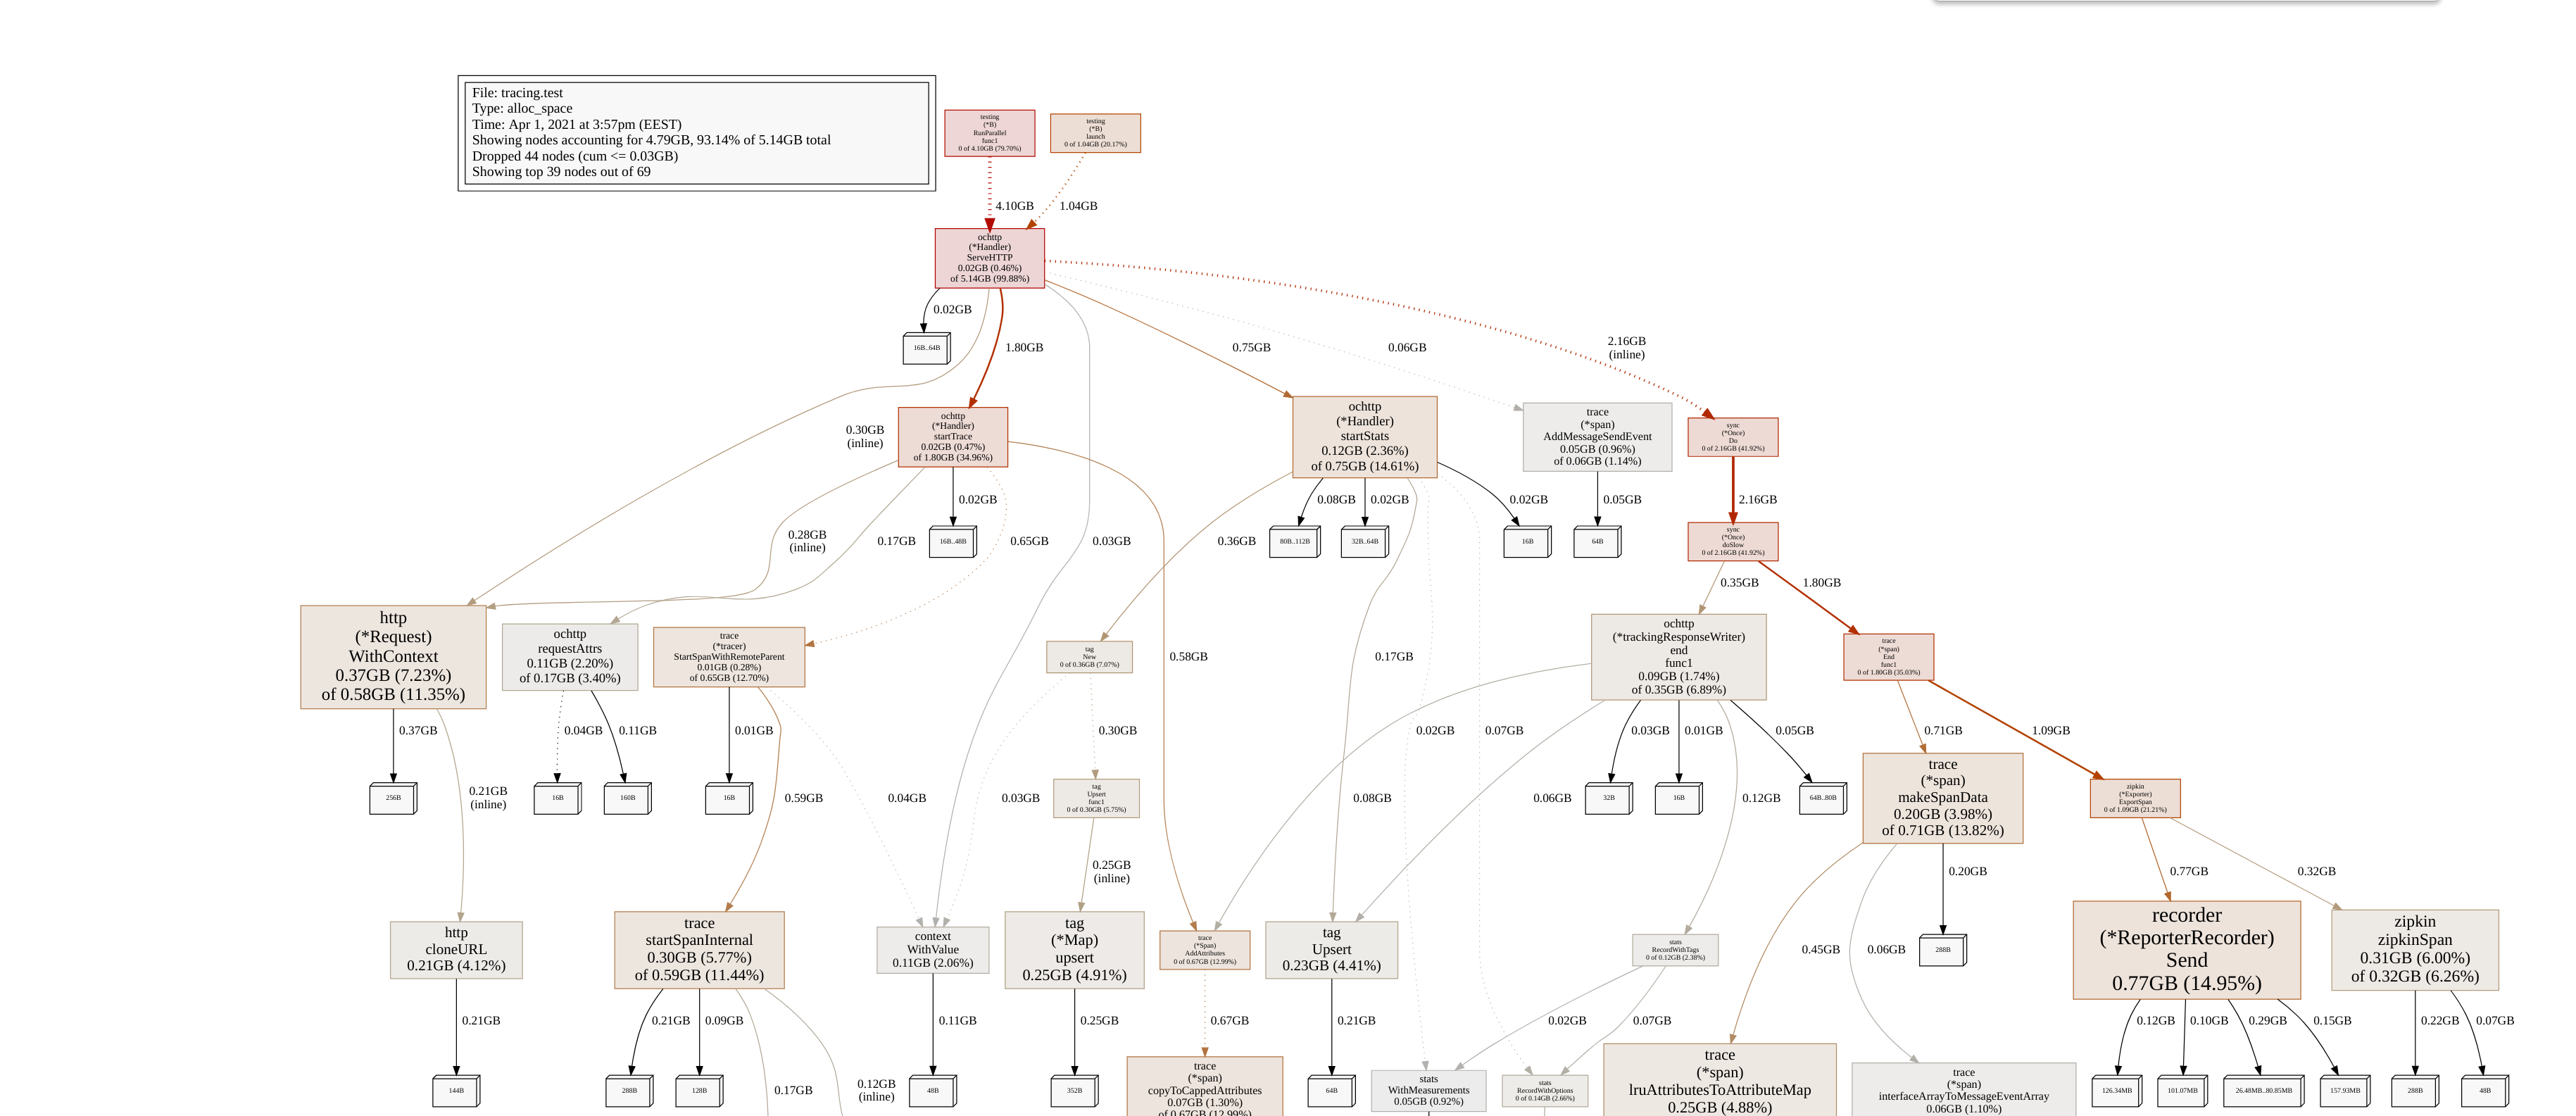
It is the baseline because the opencensus handler will not live alone but part of an http handler chain anyway. It's overhead seems non-existent by looking at the allocated objects graph:
image

Copy link
Copy Markdown
Contributor Author

Choose a reason for hiding this comment

The reason will be displayed to describe this comment to others. Learn more.

I can create a dummy doing nothing.

Copy link
Copy Markdown
Contributor

Choose a reason for hiding this comment

The reason will be displayed to describe this comment to others. Learn more.

Yeah if the tracing handler doesn't call Write (which I guess it shouldn't anyway), we should be fine.

Copy link
Copy Markdown
Contributor Author

Choose a reason for hiding this comment

The reason will be displayed to describe this comment to others. Learn more.

Actually its one allocation less (pretty predictible):

$ go test   -benchmem -memprofile memprofile.out -cpuprofile profile.out -test.v -test.bench BenchmarkSpanMiddleware -test.run ^$ ./tracing/
goos: linux
goarch: amd64
pkg: knative.dev/pkg/tracing
BenchmarkSpanMiddleware
BenchmarkSpanMiddleware/sequential
BenchmarkSpanMiddleware/sequential-12         	  141504	     10679 ns/op	    6911 B/op	      97 allocs/op
BenchmarkSpanMiddleware/parallel
BenchmarkSpanMiddleware/parallel-12           	  661308	      4737 ns/op	    6742 B/op	      97 allocs/op
PASS
ok  	knative.dev/pkg/tracing	5.204s

Copy link
Copy Markdown
Contributor

Choose a reason for hiding this comment

The reason will be displayed to describe this comment to others. Learn more.

Okay, no biggy then. Fine to keep as-is.

Copy link
Copy Markdown
Contributor Author

@skonto skonto Apr 1, 2021

Choose a reason for hiding this comment

The reason will be displayed to describe this comment to others. Learn more.

It calls the handler here, verified it also locally.

Stavros Kontopoulos added 2 commits April 1, 2021 17:42
@skonto
Copy link
Copy Markdown
Contributor Author

skonto commented Apr 1, 2021

/retest

@skonto
Copy link
Copy Markdown
Contributor Author

skonto commented Apr 1, 2021

go_gc_cpu_fraction Reporter len(d) 1 --- FAIL: TestMemStatsMetrics (1.78s)

It is irrelevant.

@skonto
Copy link
Copy Markdown
Contributor Author

skonto commented Apr 1, 2021

TestMetricsExport again.

@skonto
Copy link
Copy Markdown
Contributor Author

skonto commented Apr 1, 2021

/retest

1 similar comment
@skonto
Copy link
Copy Markdown
Contributor Author

skonto commented Apr 1, 2021

/retest

@skonto
Copy link
Copy Markdown
Contributor Author

skonto commented Apr 1, 2021

@markusthoemmes I see that the broker ingress handler and other handlers do not mix with the special opencensus http handler. This means that they cannot extract the request headers and add them to the local context (In Serving it is the opposite, for activator and queue-proxy). Trace.StartSpan() used by broker ingress handler only picks up tracing info if it already exists in current ctx. The special handler though, uses a separate call to extract tracing info from the request context eg. B3 headers. If you check the example here with istio enabled (istio propagates headers) ping source span is not shown as the parent span of the broker ingress span. However the chain looks ok bellow starting with the broker ingress span. Btw since tracing is enabled ping source should send tracing headers since it uses the observed client from cloudevents sdk. It seems like a bug to me at the Eventing side.
I see a similar example of how to use the handler here, so I guess we cannot really avoid it without breaking the span chain.

Copy link
Copy Markdown
Contributor

@markusthoemmes markusthoemmes left a comment

Choose a reason for hiding this comment

The reason will be displayed to describe this comment to others. Learn more.

/lgtm
/approve

@knative-prow-robot knative-prow-robot added the lgtm Indicates that a PR is ready to be merged. label Apr 8, 2021
@knative-prow-robot
Copy link
Copy Markdown
Contributor

[APPROVALNOTIFIER] This PR is APPROVED

This pull-request has been approved by: markusthoemmes

The full list of commands accepted by this bot can be found here.

The pull request process is described here

Details Needs approval from an approver in each of these files:

Approvers can indicate their approval by writing /approve in a comment
Approvers can cancel approval by writing /approve cancel in a comment

@knative-prow-robot knative-prow-robot added the approved Indicates a PR has been approved by an approver from all required OWNERS files. label Apr 8, 2021
@knative-prow-robot knative-prow-robot merged commit 01dccc5 into knative:main Apr 8, 2021
Sign up for free to join this conversation on GitHub. Already have an account? Sign in to comment

Labels

approved Indicates a PR has been approved by an approver from all required OWNERS files. cla: yes Indicates the PR's author has signed the CLA. lgtm Indicates that a PR is ready to be merged. size/M Denotes a PR that changes 30-99 lines, ignoring generated files.

Projects

None yet

Development

Successfully merging this pull request may close these issues.

3 participants