metrics for workloads pods and http requests missing
In what area(s)?
/area monitoring
/kind bug
What version of Knative?
0.6.0
Expected Behavior
When installing monitoring.yaml from the 0.6.0 release I should be able to open grafana from the knative-monitoring namespace and the dashboards should have data.
Actual Behavior
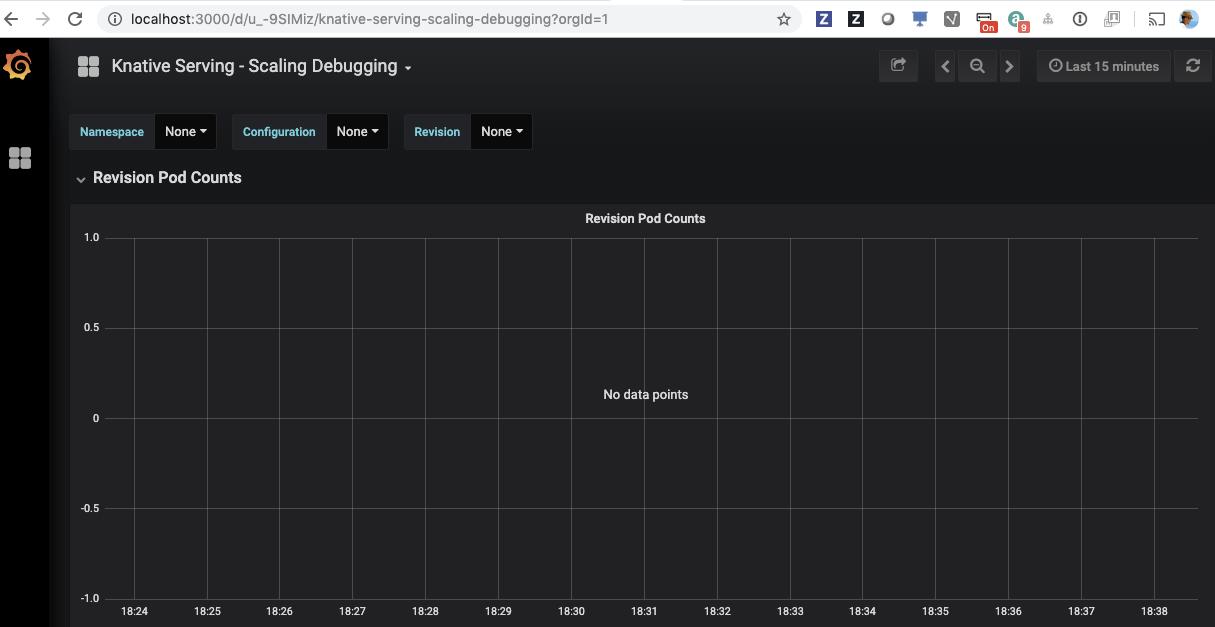
Both bashboards are empty and the drop downs don't populate with configurations or revisions instances
Steps to Reproduce the Problem
I tried in 2 environments:
-
IKS (IBM public Cloud)
-
Local using kind
-
Install knative serving including monitoring.yaml from the release page
-
Port forward grafana from knative-monitoring
kubectl port-forward --namespace knative-monitoring \
$(kubectl get pods --namespace knative-monitoring \
--selector=app=grafana --output=jsonpath="{.items..metadata.name}") \
3000
- Open dashboards
- "Knative Serving - Scaling Debugging"
- "Knative Serving - Revision HTTP Requests"
- Results: No data found
Other dashboards have data about knative control plane.
metrics for workloads pods and http requests missing
In what area(s)?
/area monitoring
/kind bug
What version of Knative?
0.6.0
Expected Behavior
When installing monitoring.yaml from the 0.6.0 release I should be able to open grafana from the knative-monitoring namespace and the dashboards should have data.
Actual Behavior
Both bashboards are empty and the drop downs don't populate with configurations or revisions instances
Steps to Reproduce the Problem
I tried in 2 environments:
IKS (IBM public Cloud)
Local using kind
Install knative serving including monitoring.yaml from the release page
Port forward grafana from knative-monitoring
Other dashboards have data about knative control plane.