See documentation for more details on the library and changelog for recent history of changes.
Copyright © 2009-2015 CEA, Pierre Raybaut, licensed under the terms of the CECILL License.
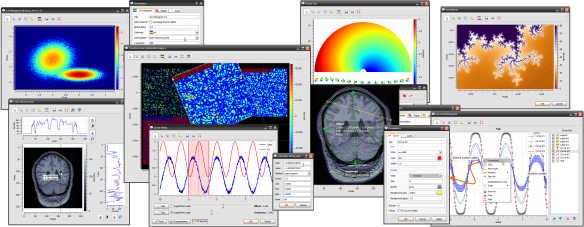
Based on PythonQwt (a pure Python/PyQt reimplementation of the curve
plotting Qwt C++ library, included in plotpy base source code) and on the
scientific modules NumPy and SciPy, plotpy is a Python library providing
efficient 2D data-plotting features (curve/image visualization and related
tools) for interactive computing and signal/image processing application
development. It is based on Qt graphical user interfaces library, and
currently supports both PyQt4 and PyQt5.
Extension to PythonQwt:
- set of tools for curve and image plotting
- GUI-based application development helpers
PythonQwt is no longer required as it is now embedded in plotpy.
The setup.py script supports the following extra options for
optimizing the image scaler engine with SSE2/SSE3 processors:
--sse2 or --sse3.
python setup.py build installpython setup.py build installpython setup.py build -c mingw32 install