
This R package provides functions for creating Krona charts and displaying/embedding them as HTML widget in different contexts or using them in Shiny applications.
Krona charts are commonly used as interactive visualizations of the taxa in metagenomic and metabarcoding (microbiota) samples, but can in principle be used to visualize all kinds of hierarchical data.
This package and does not require any additional software to be installed. It aims to be as flexible as possible.
The snapshot feature allows embedding chart snapshots in non-interactive documents such as PDF or Word (see tutorial).
To install the R package:
# install.packages('remotes')
remotes::install_github('markschl/taxplore')
The KronaTools software collection is not needed. This package includes a copy of the Krona JavaScript and is able to generate charts that are (nearly) identical to the ones generated by KronaTools.
The documentation is at https://markschl.github.io/taxplore.
Two in-depth tutorials are available:
- A general feature overview and tutorial
- Additional examples with phyloseq datsets
library(taxplore)There are two main functions:
This function generates Krona charts from hierarchical data in data frames/matrices, phyloseq objects or hierarchical list data structures.
Example:
data(grasslandfungi.records)
make_krona(grasslandfungi.record_tax, outfile = 'krona_chart.html')Display the hierarchical charts, either as interactive plots launched
from the console, or embedded in
R-Markdown/Quarto
documents or Shiny applications. It accepts
the same input data as make_krona(), or can be used to display
pre-generated charts.
plot_krona(grasslandfungi.records)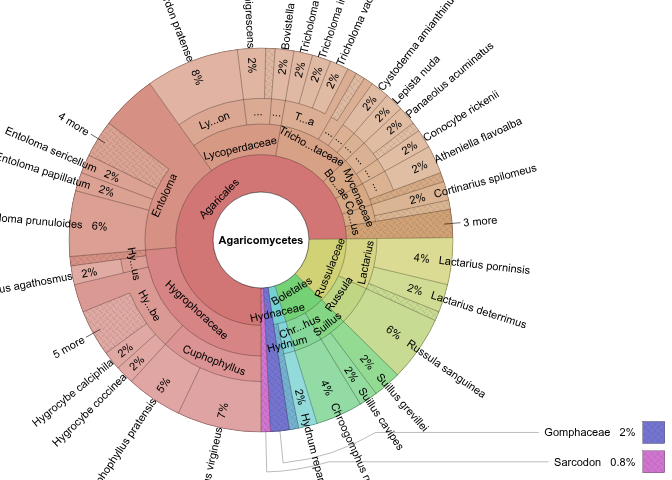
This project includes unmodified copy of some files from https://github.com/marbl/Krona, notably the JavaScript code and images included in the HTML charts.
In addition, a “minified” version of the script is provided (see installation script). When embedding charts, additional JavaScript code is sometimes injected for adjusting settings and taking static snapshots.
KRONA is a trademark of its respective owners (see KRONA_LICENSE). This project is not affiliated with the Krona authors. The documentation and some function names still contain “Krona” as a term to describe these charts.
- taxburst is a Python-based alternative to KronaTools