MRG+1, ENH: add border argument for topomap extrapolation #7193
Conversation
|
this seems useful. Is this option offered by any other software? |
|
@agramfort Unfortunatelly I don't know. Probably some packages do something like |
|
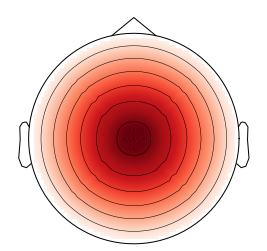
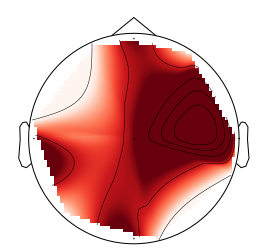
It just became an issue for me lately when plotting log-transformed power - all the topo values were negative (in the range of -12 or -11) so the default extrapolation border of 0 looked very weird (the topo values could not be discerned). |
|
all other packages use zero outside interpolation? I would like to make sure MNE users |
 larsoner
left a comment
larsoner
left a comment
There was a problem hiding this comment.
border='mean' seems like it might make a sensible new default. Our topomaps will already be changing a bit in this cycle because of #7066 so it's not a bad time to do it. Arguably it could be a bug fix...
You could try setting border='auto' in these PRs and doing a commit with [circle full] in the message so we could see how all topomap examples look with the new default. If they all look at least as good or better, then it's a good reason to switch / consider it a bugfix.
|
@larsoner BTW, I am writing a test for this PR and it seems I do not understand well the way channel positions are handled in plot_topomap currently. I create 5 fake channels and try to mach the sphere radius to their positions: import numpy as np
import mne
ch_names = list('abcde')
ch_pos = np.array([[0, 0, 1], [1, 0, 0], [-1, 0, 0],
[0, -1, 0], [0, 1, 0]])
ch_pos_dict = {name: pos for name, pos in zip(ch_names, ch_pos)}
dig = mne.channels.make_dig_montage(ch_pos_dict, coord_frame='head')
data = np.ones(5) * 5
info = mne.create_info(ch_names, 250, ['eeg'] * 5)
info.set_montage(dig)
ax, _ = mne.viz.plot_topomap(data, info, extrapolate='head',
border=0, sphere=1.)my expectation was that the radius of However, if change the radius to be ax, _ = mne.viz.plot_topomap(data, info, extrapolate='head',
border=0, sphere=0.1)the channel position is better but the exrapolation is weird: I expected that |
|
If that is unexpected I can try to fix that in a subsequent PR. |
|
@agramfort - I can check eeglab and fieldtrip later this week. I think some of the figures in eeglab are in |
IIRC the points with z=0 should be on the head outline, points with z>0 should be inside, z<0 should be outside (i.e., radius only depends on z) and the x/y should determine the angle. I think this was the intent. Though there might also be some interaction with the head size / radius in there, too -- for example you might need both that z=0 and So you might have indeed found a bug. Any unit tests you can write to check these cases would be welcome. But first we should decide on the behavior. To me it makes sense to have the radius be given by some multiplicative factor dependent on z: z=0 gives a factor of 1, z > 0 gives factors < 1, z < 0 gives factors > 1. And then there is also a multiplicative factor like But IIRC when you go to implement, I think all the computations no longer use normalized units, so the head sphere will extend to a radius of, e.g., 0.1 instead of 1. If this does not make sense or you want to hash it out interactively, I'm on |
Yes, that was my expectation at least, so I think we are on the same page.
I'm not sure I understand it here - I had my channel positions be on z=0 and x=0, y=1 for example and asked for |
Yes that sounds like errant behavior. I'm just saying that when you eventually go to write unit tests for this sort of thing, if you use a head radius of something other than 1. you shouldn't expect |
Ah, sure. :) |
Codecov Report
@@            Coverage Diff             @@
##           master    #7193      +/-   ##
==========================================
+ Coverage   89.76%   89.77%   +<.01%
==========================================
  Files         445      445
  Lines       79874    80013     +139
  Branches    12773    12792      +19
==========================================
+ Hits        71702    71832     +130
- Misses       5374     5375       +1
- Partials 2798 2806 +8 |
|
Hm, I have a strange Travis error in the topomap test. I can't reproduce locally. It seems no contour levels are created, but matplotlib does: ――――――――――――――――――――――――――― test_plot_topomap_basic ――――――――――――――――――――――――――――
mne/viz/tests/test_topomap.py:214: in test_plot_topomap_basic
ax, _ = plot_topomap(data, info, extrapolate='head', border='mean', sphere=1)
mne/viz/topomap.py:686: in plot_topomap
sphere=sphere, border=border)[:2]
mne/viz/topomap.py:837: in _plot_topomap
linewidths=linewidth / 2.)
../../../miniconda/envs/test/lib/python3.5/site-packages/matplotlib/__init__.py:1898: in inner
return func(ax, *args, **kwargs)
../../../miniconda/envs/test/lib/python3.5/site-packages/matplotlib/axes/_axes.py:5825: in contour
contours = mcontour.QuadContourSet(self, *args, **kwargs)
../../../miniconda/envs/test/lib/python3.5/site-packages/matplotlib/contour.py:865: in __init__
self._process_levels()
../../../miniconda/envs/test/lib/python3.5/site-packages/matplotlib/contour.py:1199: in _process_levels
self.vmin = np.amin(self.levels)
../../../miniconda/envs/test/lib/python3.5/site-packages/numpy/core/fromnumeric.py:2352: in amin
out=out, **kwargs)
../../../miniconda/envs/test/lib/python3.5/site-packages/numpy/core/_methods.py:29: in _amin
return umr_minimum(a, axis, None, out, keepdims)
E ValueError: zero-size array to reduction operation minimum which has no identity |
|
Probably a Or if you to punt on this and work around it, you can probably make your data out of |
|
I will soon add |
Codecov Report
@@            Coverage Diff            @@
##           master   #7193      +/-   ##
=========================================
+ Coverage   89.76%   89.8%   +0.03%
=========================================
  Files         445     445
  Lines       79874   80338     +464
  Branches    12773   12903     +130
=========================================
+ Hits        71702   72144     +442
- Misses       5374    5380       +6
- Partials 2798 2814 +16 |
|
@mmagnuski did you sort out the scaling issues? Curious to know what the problem was if you did / when you do |
|
@larsoner, no, I didn't get to it yet. I will do that in a separate PR just after this one. The joy of debugging awaits! :) |
|
I've added/exposed the
I have changed
I would also prefer to test changing the default |
|
Yes that sounds like a good plan to me Ready for review? |
|
Yes :) |
|
@mmagnuski can you jsut update latest.inc to update what's new page? thx |
|
Ah, right, sure! |
|
@agramfort - done. |
|
thanks @larsoner and @agramfort ! 🚀 |
…7193)

* ENH: add border argument for topomap extrapolation

* TST: add tests

* DOC: turn to replicable %()s docs

* STY: make flake happy

* TST: fix test so that contours can be drawn

* ENH: safety checks

* TST: add test for type and value errors

* adding border to other functions

* ENH: add border where extrapolate was exposed

* FIX: fix ValueError test

* DOC: add whats new / latest
Reference issue
Continuation of topomap extrapolation pull request.
What does this implement/fix?
This adds a
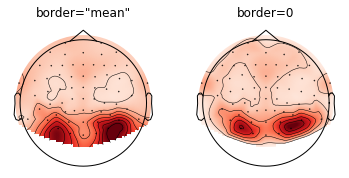
borderargument tomne.viz.plot_topomapthat allows to change the values set to extrapolation points. The default is zero, just as before, but'mean'allows to extrapolate to mean of channels that are neighbours to given extrapolation point. See the example below:(I know, I will have to fix the channel positions after the recent changes to plot_topomap channel position handling)
border='mean'is especially useful when plotting log-power (and settingvmin,vmax):This is a draft at this point, but feel free to comment.
TODOs:
%()sdocsborderin other topomap functions?