You signed in with another tab or window. Reload to refresh your session.You signed out in another tab or window. Reload to refresh your session.You switched accounts on another tab or window. Reload to refresh your session.Dismiss alert
If you pass the model instance to HeadFile with the MF2005/MFNWT instances, HeadFile.plot() will mask ibound==0 so you can see the simulated values in the colormap. The same call for an MF6 model does show the idomain inactive areas as black, but the array isnt being masked before plotting, so you get extreme values:


If you pass the model instance to
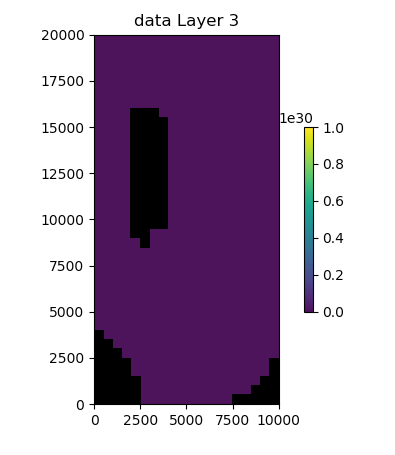
HeadFilewith the MF2005/MFNWT instances,HeadFile.plot()will maskibound==0so you can see the simulated values in the colormap. The same call for an MF6 model does show the idomain inactive areas as black, but the array isnt being masked before plotting, so you get extreme values: