Closes #391: Pad series text to be same length as x axis#392
Merged
Conversation
50dcfb2 to
3221d72
Compare
emtwo
approved these changes
May 3, 2018
 emtwo
left a comment
emtwo
left a comment
There was a problem hiding this comment.
Thanks for the fix, @washort! This looks good to me. I'm going to add some details for context and regression testing to be used in the future:
STR:
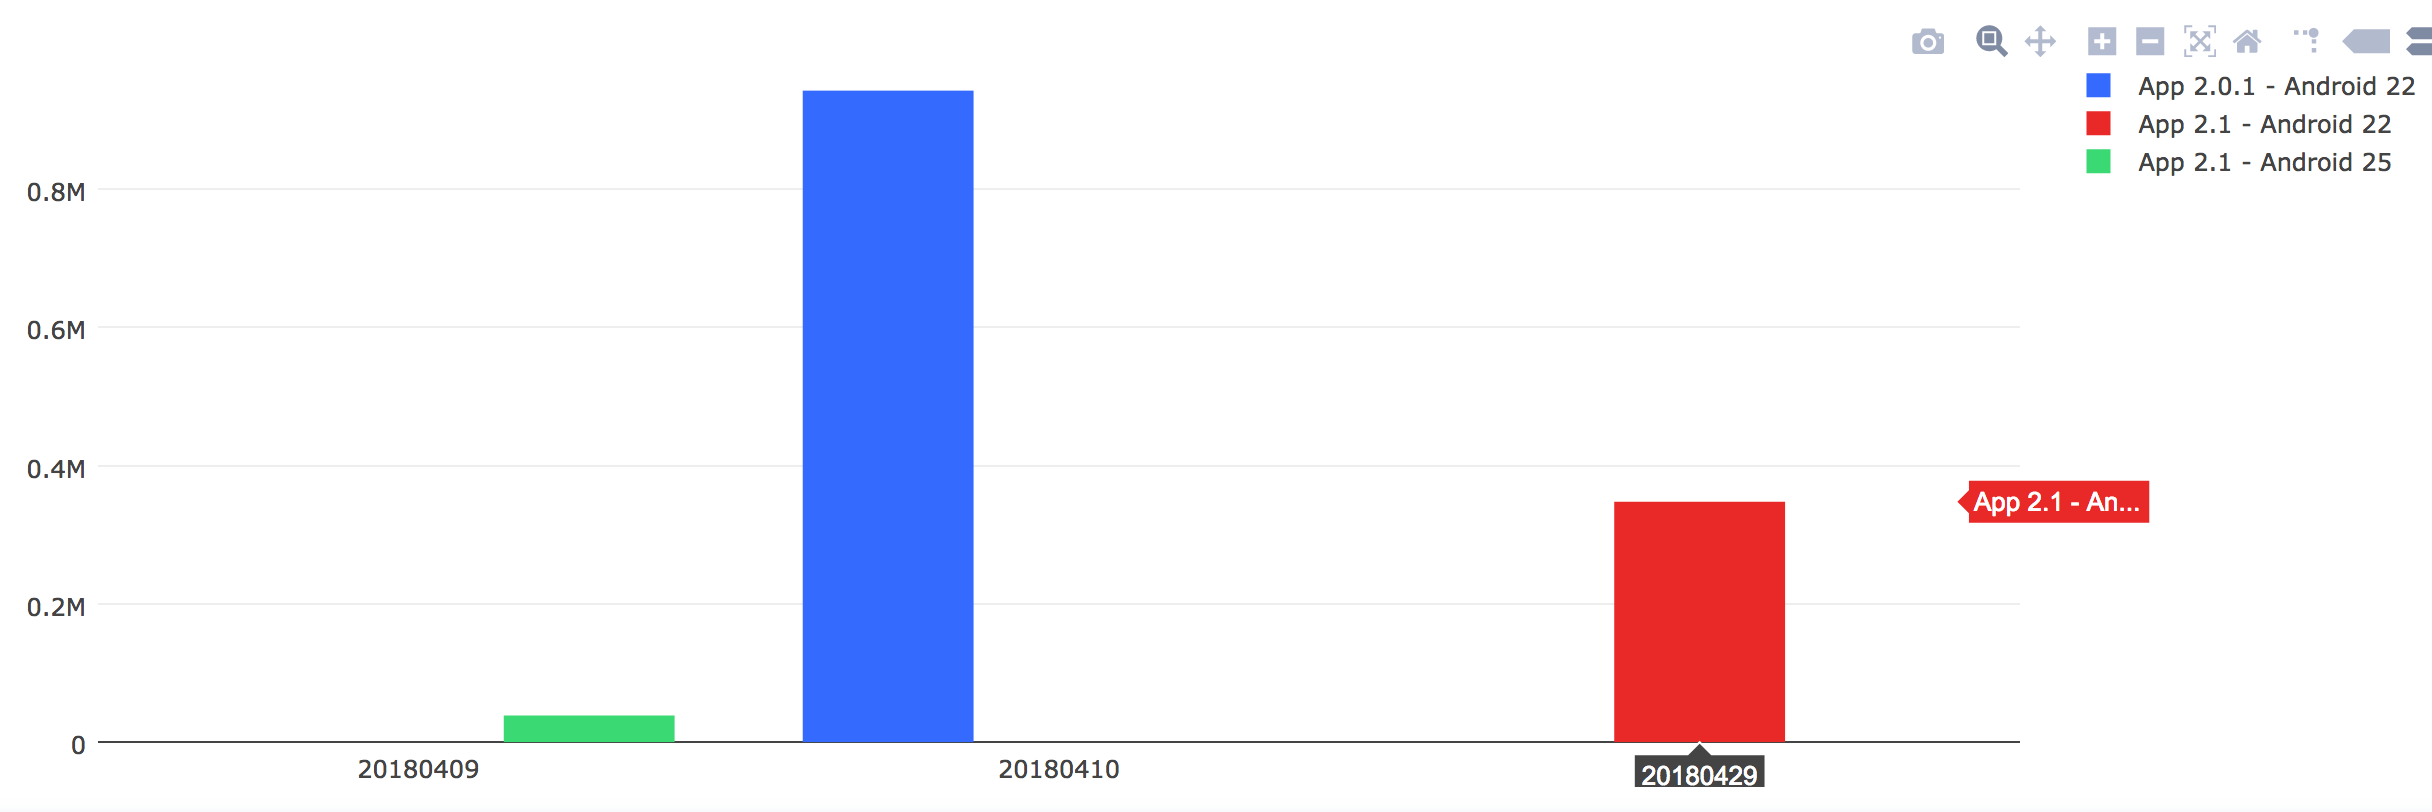
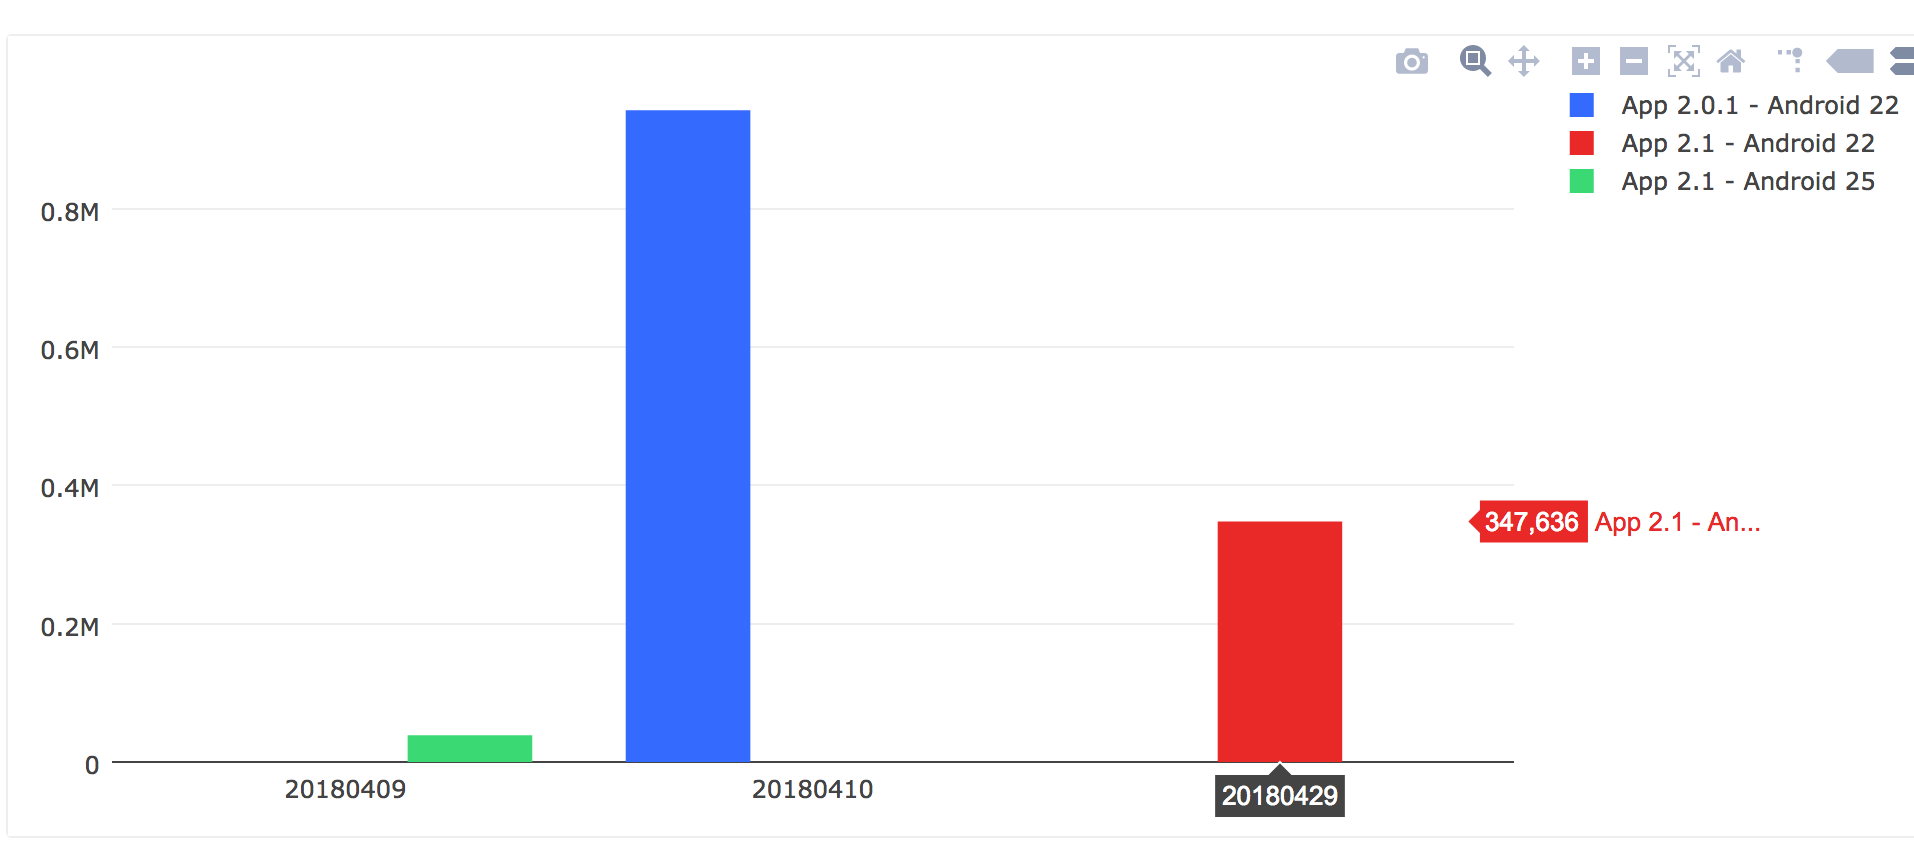
- Create a query with this text:
WITH sample AS
    (SELECT 942094 as client_count, 20180410 as submission_date, 'App 2.0.1 - Android 22' as version UNION
    SELECT 38761 as client_count, 20180409 as submission_date, 'App 2.1 - Android 25' as version UNION
    SELECT 347636 as client_count, 20180429 as submission_date, 'App 2.1 - Android 22' as version)
SELECT * FROM sample
- Create a bar graph visualization where
X Columnissubmission_date,Y Columnsisclient_count, andGroup byisversion.
Before the bugfix: the y value does not show on hover:
After the bugfix: the y value shows on hover:
Author
|
Thanks! |
This file contains hidden or bidirectional Unicode text that may be interpreted or compiled differently than what appears below. To review, open the file in an editor that reveals hidden Unicode characters.
Learn more about bidirectional Unicode characters
Sign up for free
to join this conversation on GitHub.
Already have an account?
Sign in to comment
2 participants
Add this suggestion to a batch that can be applied as a single commit.This suggestion is invalid because no changes were made to the code.Suggestions cannot be applied while the pull request is closed.Suggestions cannot be applied while viewing a subset of changes.Only one suggestion per line can be applied in a batch.Add this suggestion to a batch that can be applied as a single commit.Applying suggestions on deleted lines is not supported.You must change the existing code in this line in order to create a valid suggestion.Outdated suggestions cannot be applied.This suggestion has been applied or marked resolved.Suggestions cannot be applied from pending reviews.Suggestions cannot be applied on multi-line comments.Suggestions cannot be applied while the pull request is queued to merge.Suggestion cannot be applied right now. Please check back later.
Labels were not being displayed properly for multiple series when they didn't all have data points for every value on the x axis. This pads it out with nulls to line them up.
closes #391