implement geom_rect #175
Description
Alex added support for SVG shapes... including rectangles, so we should be able to support ggplot2 figures like many of these now:
This has come up a lot from cloud and Enterprise users, so excited to finally cross this off the checklist.
https://plot.ly/~etpinard/1647/plotly-shapes/
Test cases:
http://docs.ggplot2.org/current/geom_rect.html
http://stackoverflow.com/questions/18155165/add-new-item-to-ggplot2-legend
I looked through the ggplotly examples for some rects, and I found this
which gets translated to this in plotly
which are traces of mode "lines" with fill "tozerox"
I noticed that the new plotly "shapes" are not implemented as traces, so in fact we have a design choice to make. Do we implement geom_rect as plotly "lines" or as plotly "shapes" ?
Are there speed advantages to one or the other? Is there some advantage for the user in terms of interpreting the data?
Sure, that works to an extent. It's a little hacky, depending on us interpreting fill to zero in a particular way that we might not always want to do. I'm also surprised that this didn't trigger autoscale to zero too... but we could always add a fill mode like "toself" tailored for this, perhaps even supporting multiple polygons in a single trace.
And you're right to think about speed - if you get a lot of rectangles, traces will probably be faster, especially during dragged zooms/pans when the whole trace area just gets stretched but shapes and annotations get redrawn on every mousemove.
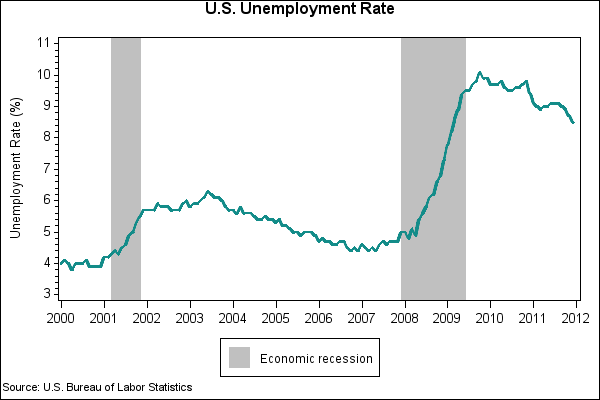
The biggest thing you miss with traces is paper-referenced and mixed-reference shapes. For example if you want to shade a particular x range, but have the whole y range covered no matter how you zoom (as with geom_tallrect from animint), and without affecting autorange in y. Something like:
http://support.sas.com/kb/42/addl/fusion_42893_2_g42893.png
Then you'd make a shape like:
{x0: '2007-10', x1: '2009-05', y0: 0, y1: 1, xref: 'x', yref: 'paper'}