[mixins] Alertmanager Overview dashboard#2540
Conversation
The dashboard aims to show an overview of the overall health of Alertmanager.

Signed-off-by: ArthurSens <arthursens2005@gmail.com>
a5e0f1a to
2729314
Compare
Signed-off-by: ArthurSens <arthursens2005@gmail.com>
Signed-off-by: ArthurSens <arthursens2005@gmail.com>
|
Hi @beorn7, apologies for the delay! What do you think of the result? Anything you'd like me to change? |
 beorn7
left a comment
beorn7
left a comment
There was a problem hiding this comment.
Just some formatting nits in the comments.
|
How about providing screenshots here so that reviewer can more easily see the results of this? |
beorn7
left a comment
There was a problem hiding this comment.
Now "real" comments about the dashboard.
Bottom line: Let's focus on the first half of dashboards first (which contain the meat, I'd say) and let's get them right. With the suggested break-out by instance and AM cluster (rather than K8s cluster), those will get complex enough to get right. So let's focus on those first. It might also become a quite rich dashboard already if we have separate panels per integration.
| template.new( | ||
| name='cluster', | ||
| datasource='$datasource', | ||
| query='label_values(alertmanager_alerts, %s)' % $._config.clusterLabel, |
There was a problem hiding this comment.
I'm not quite sure if this is doing what you want.
An Alertmanager cluster is a different thing from a Kubernetes cluster (or generally a cluster of nodes you run services on). In fact, for HA, an Alertmanager cluster will commonly span multiple K8s clusters. Ideally, you have only one (global) Alertmanager cluster in your org, but should you have multiple (e.g. you have a dev cluster, or you have strictly separate network partitions, each of which needs its own Alertmanager cluster), then you want your dashboard to switch between those, and when viewing at a particular Alertmanager cluster, you want to see all instances included there, even if they run in different K8s clusters.
In fact, the mixin already has this concept of an Alertmanager cluster, see alertmanagerClusterLabels and alertmanagerClusterName in config.libsonnet. So ideally, your multi-cluster support utilizes those. The mixin allows for multiple labels to define the Alertmanager cluster, which makes the templating here hard. But I think it's possible.
There was a problem hiding this comment.
Particularly, my setup consists of multiple k8s clusters with one alertmanager per cluster that do not communicate between themselves. I understand that my setup is not the usual Alertmanager-HA that we all should aim for, but I think I won't be able to test the filter using alertmanagerClusterLabels 😬
There was a problem hiding this comment.
In your case, you have "one-instance clusters", and the alertmanagerClusterLabels could indeed be just cluster.
Maybe the only problem is that the mixin as-is allows multiple labels for alertmanagerClusterLabels (which I introduced because it was easy at the time, and I think it's needed in some use cases). In fact, here at GL, we use job, namespace as the alertmanagerClusterLabels. job is usually something like global-alertmanager while namespace can be used to, for example, have a production global AM cluster and a separate test cluster.
I think this should all work, just that you need to jump through some jsonnet hoops to iterate through all the labels in alertmanagerClusterLabels and dynamically create the corresponding template variables for Grafana. (This will be easier if alertmanagerClusterLabels is a list. But we can totally make it one.)
The Grafana query_result(query) might also help here. See https://grafana.com/docs/grafana/latest/datasources/prometheus/#query-variable
| fill=1, | ||
| legend_show=true, | ||
| ) | ||
| .addTarget(prometheus.target('sum(rate(alertmanager_notifications_failed_total{%(alertmanagerSelector)s, %(clusterLabel)s="$cluster"}[5m])) by (integration)' % $._config, legendFormat='{{integration}}')); |
There was a problem hiding this comment.
Same as above, I think it makes more sense to have it broken up per instance.
|
Tests were flaky, I re-ran them, and they succeeded. |
Signed-off-by: ArthurSens <arthursens2005@gmail.com>
|
Thanks a lot for the detailed review! I think the main problem with my first implementation is because I don't use an HA setup for my alertmanagers. It also made me think about why I don't have an HA setup in the first place... 😅 I'll remove all the low-level metrics added and focus on the "meat", i.e. alert delivery. |
Signed-off-by: ArthurSens <arthursens2005@gmail.com>
|
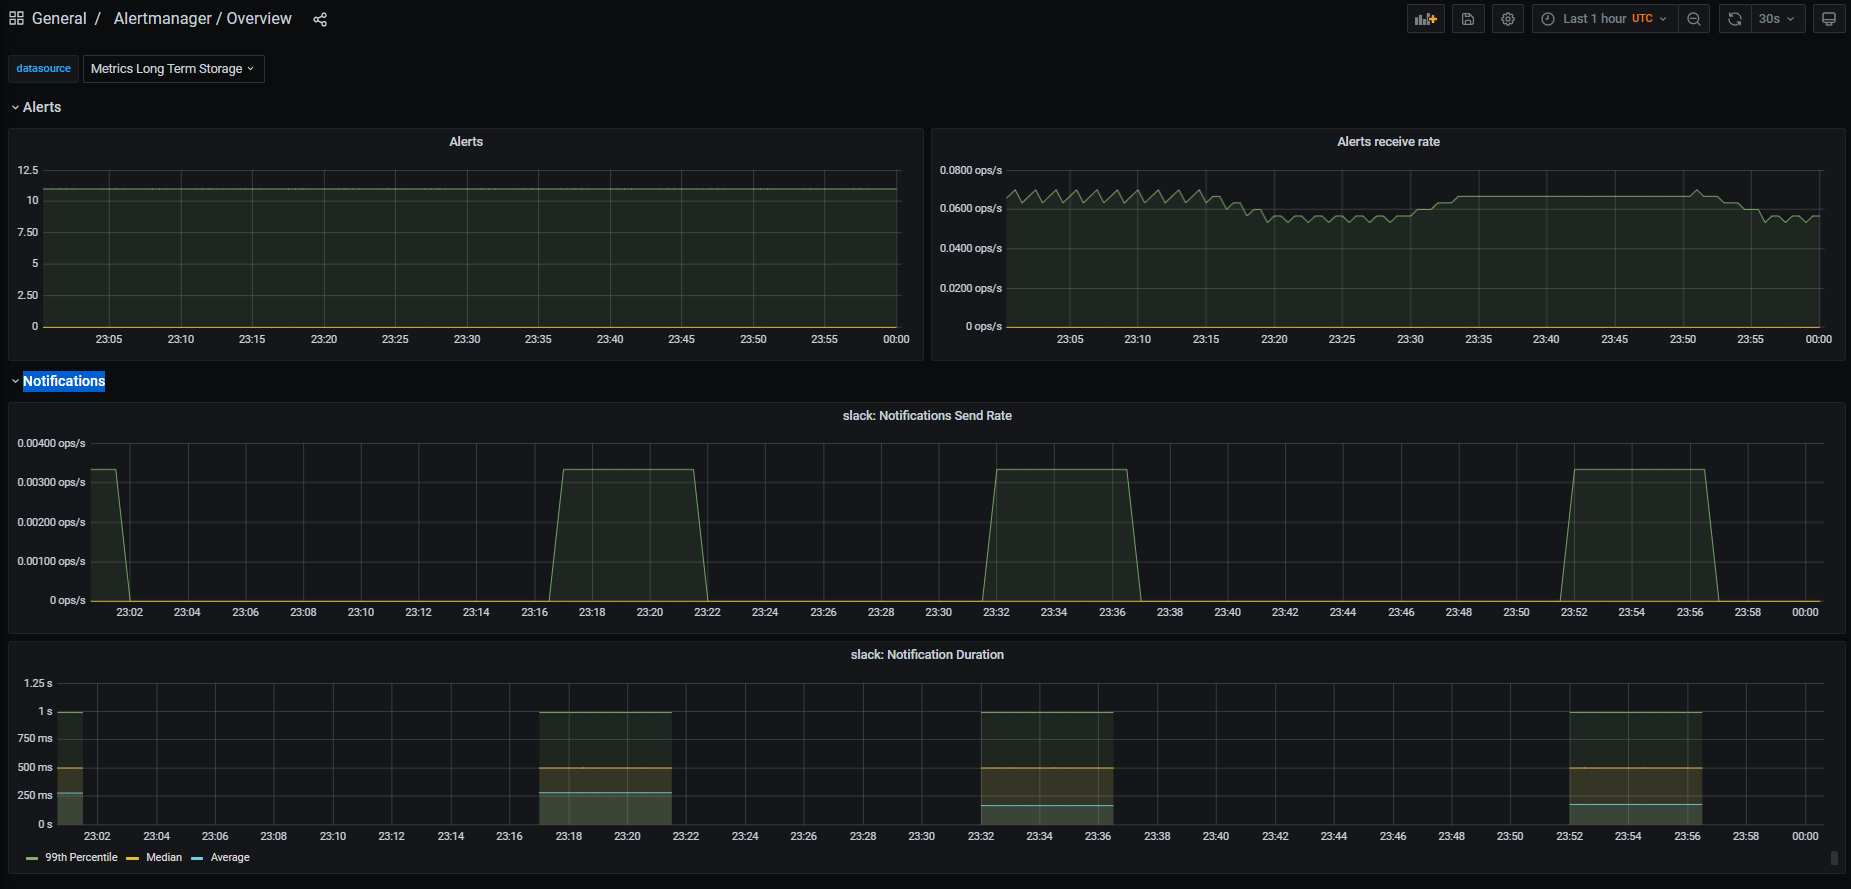
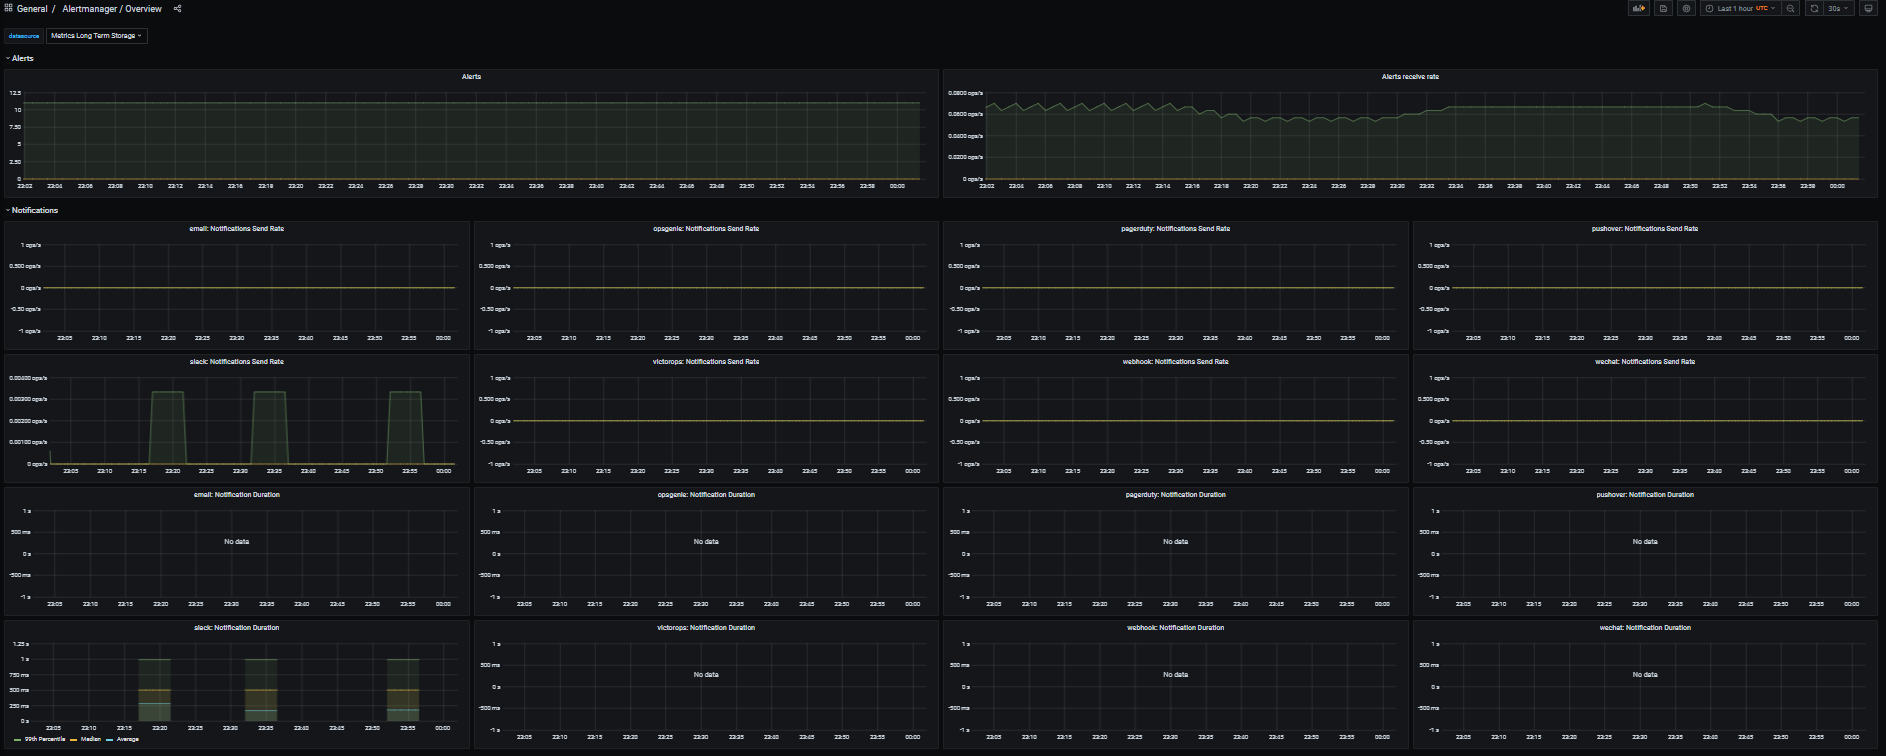
I've cleaned-up all the low-level metrics, leaving only Alerts received and Notifications sent. The panels repeat over an Not much to see if we use just a few integrations, but can become quite packed if using all integrations...
|
|
Turning the PR into a draft until I think of a good way to show HA set ups... |
Signed-off-by: ArthurSens <arthursens2005@gmail.com>
Signed-off-by: ArthurSens <arthursens2005@gmail.com>
|
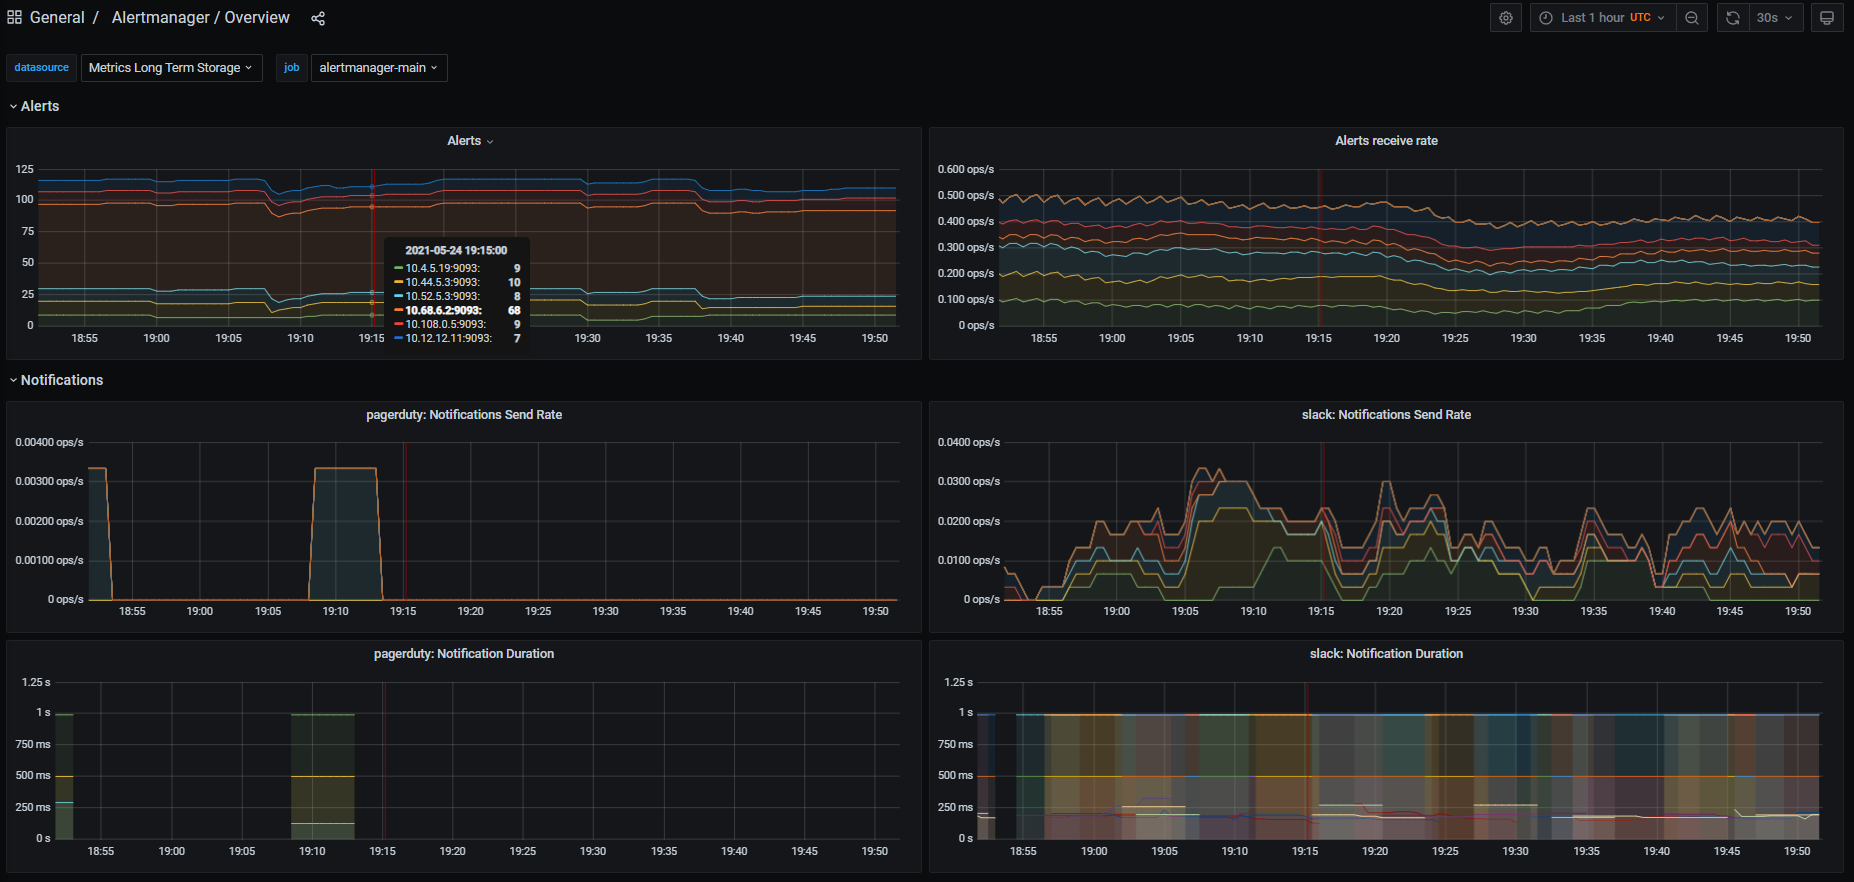
Hi @beorn7 and @paulfantom, I've refactored the PR to support multiple Alertmanager HA-clusters instead of multiple k8s clusters. Please take another look when possible 🙂 I think I haven't done breaking changes to the mixin, but please pay some extra attention to the changes done in Here is an example dashboard:
|
|
Thanks, @ArthurSens . I'll have a look as soon as possible (which might not be very soon – very sorry, too much backlog). @paulfantom , your feedback would be very appreciated. |
beorn7
left a comment
There was a problem hiding this comment.
I'm not a real expert in jsonnet, mixins, and dashboards, so I don't feel qualified to improve details on the dashboard is it is now. I think it's a good starting point, and we can iterate on it based on results from people actually using it in different scenarios. (But if any of the experts have something to improve right now, please go ahead.)
Below just a few comments on the _config fields. I realize that some of my suggestions will break people that have set alertmanagerName. But since we are now using parallel naming for dashboards, with slightly different generation, I'd say let's better break them noticeable than causing a surprise that the names on the dashboard suddenly look different than the one in the alerts.
Signed-off-by: ArthurSens <arthursens2005@gmail.com>
|
Thanks again for the review Beorn, I've moved the mentioned variables from config to the dashboard libsonnet |
| // alertmanagerName is an identifier for alerts that is built from 'alertmanagerNameLabels' | ||
| alertmanagerName: std.join('/', ['{{$labels.%s}}' % [label] for label in std.split(c.alertmanagerNameLabels, ',')]), |
There was a problem hiding this comment.
I would either move this out of _config, too, or change the comment to "alertmanagerName is an identifier for alerts. By default, it is built from 'alertmanagerNameLabels'."
There was a problem hiding this comment.
I'd like to leave this in config just for backward compatibility. PrometheusRules created by this mixin use this field in alert descriptions.
Signed-off-by: ArthurSens <arthursens2005@gmail.com>
|
Thanks, Beorn 🙂 I think the PR is getting to its last moments, would you like me to squash commits? |
beorn7
left a comment
There was a problem hiding this comment.
I think the backwards compatibility is an issue anyway because those that used to override alertmanagerName now probably need to set alertmanagerNameLabels. I'd say better break in a noticeable way.
Furthermore, having alertmanagerName in alert descriptions doesn't really require to have it as a configurable variable.
But on the other hand, users might ask for it anyway. The whole mixin is experimental anyway, so let's not try too hard to get it perfect.
I'll squash and merge, and we'll see what feedback we get.
|
Sorry, this was completely lost in an influx of GitHub notifications (I really need to fix my setup for this). But I am happy you managed to finalize this. Let's include it in kube-prometheus and gather community feedback. @ArthurSens would you mind bringing this into kube-prometheus? |
|
Yep, I'll try to open the PR on kube-prometheus today or tomorrow 🙂 |
Fixes #2529