dendrograms, correlation and marker genes filtering#425
dendrograms, correlation and marker genes filtering#425falexwolf merged 25 commits intoscverse:masterfrom
Conversation
…trix to dendrogram info.
… heatmap of the correlation matrix of a given groupby observation. Updated tests.
…genes based on fold change and expression
|
Sorry for the late response! This seems to have come just after I went through the issues last weekend... It looks great! 😄 Some small notes:
Thanks again! |
|
@falexwolf thanks for the feedback. :) I agree with your comments on the Currently, by default What tl.dendrogram does not do is to use the underlying network to compute a distance matrix as I think seurat does and apparently you also do in PAGA. For me, what is important is that the plotting functions get the dendrogram data from |
|
Great! 😄
That is fine: if you just compute distances on the medians/medoids that's a small-scale problem that won't cost any time. If Seurat uses medians, they will not use the underlying network, because they aren't contained in there. If they use medoids, they might use the underlying network, but it will be negligible save in compute time... So don't worry about that... |
|
I will get back to this as soon as I can. Meanwhile lets keep the PR open. |
|
Just let me know when you think this is ready to go! |
|
I am getting an error elsewhere that I want to revise before submitting a final version. Hopefully tomorrow |
…stacked_violin colors
…er plotting functions (heatmap, matrixplot, dotplot etc)
|
I think it is ok to merge now. I also updated some of the plotting functions to accept a
What is missing is |
|
@fidelram how can I try your |
|
@falexwolf Can we merge this branch? |
3efb194 to
fc84096
Compare
|
Ah, sorry for being in the way here with the unrelated logging changes. Alex is currently a bit ill I learned, which is why he probably didn’t do it yet. I didn’t have time to review the whole thing, but if y’all want I can do that too |
|
Please go ahead!
…On Tue, Feb 12, 2019 at 6:41 PM Philipp A. ***@***.***> wrote:
Ah, sorry for being in the way here with the unrelated logging changes.
Alex is currently a bit ill I learned, which is why he probably didn’t do
it yet. I didn’t have time to review the whole thing, but if y’all want I
can do that too
—
You are receiving this because you were mentioned.
Reply to this email directly, view it on GitHub
<#425 (comment)>, or mute
the thread
<https://github.com/notifications/unsubscribe-auth/AEu_1RE9LYK4sL6sLFd586y_cpEBQKxwks5vMvzRgaJpZM4Z-M3d>
.
|
|
@fidelram @flying-sheep reiterating my interest in trying this out 💯 |
|
Sorry about the terribly late response. I was super sick for weeks. Thank you so much, @fidelram. Let's merge it. :) |
|
Thanks! |
|
Thanks a lot. All of these new features are what we need! I notice that the tutorial has not been updated yet (such as sc.tl.filter_rank_genes_groups( ) and rna velocity function in https://github.com/theislab/scanpy/tree/master/scanpy/tools). I find these features occasionally. Could you add them in scanpy tutorial ? |
|
Recently, this tutorial was updated with what you need:
https://scanpy-tutorials.readthedocs.io/en/latest/visualizing-marker-genes.html
You can find the link to that tutorial from
https://scanpy.readthedocs.io/en/latest/
…On Fri, Mar 15, 2019 at 3:34 PM jiawen wang ***@***.***> wrote:
Thanks a lot. All of these new features are what we need!
I notice that the tutorial has not been updated yet (such as
sc.tl.filter_rank_genes_groups( ) and rna velocity function in
https://github.com/theislab/scanpy/tree/master/scanpy/tools). I find
these features occasionally. Could you add them in scanpy tutorial ?
—
You are receiving this because you were mentioned.
Reply to this email directly, view it on GitHub
<#425 (comment)>, or mute
the thread
<https://github.com/notifications/unsubscribe-auth/AEu_1S565VMCgOnXCQetV2R6_A1HONPZks5vW69qgaJpZM4Z-M3d>
.
|
dendrograms, correlation and marker genes filtering
This PR makes more transparent the computation of the hierarchical clustering underlying the dendrograms. Now, by default, the dendrograms are computed based on the PCA using
sc.tl.dendrogram.Also, now is possible to directly plot a dendrogram without any other data:
Since for the computation of the hierarchical clustering, a correlation matrix is computed I also added a visualization for this (mostly borrowing code from https://github.com/deeptools/deepTools). The new plotting function is called
sc.pl.correlationAlso I added a function to filter the results from
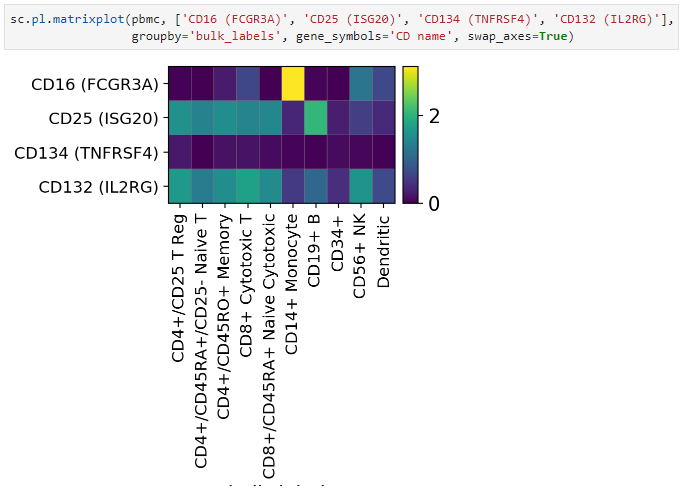
sc.tl.rank_genes_groupsbased on fold change and fraction of genes that are expressing the gene within and outside the group by categories.For example,
The first image show the case without filtering.