An interactive dependency map for Django projects. Merges two sources of structural information and renders them as a live, browsable graph:
graph_models(django-extensions) → model-level FK / M2M relationshipsgrimp→ actual Python import relationships between apps
Produces a self-contained HTML file, a live Django view, and an optional Django Debug Toolbar panel. Includes CI-friendly --check mode for detecting import cycles and violations in pipelines.
- Installation
- Quick start
- Management command
- Live Django view
- Django Debug Toolbar panel
- Reading the graph
- Scenario planning: show/hide apps
- Cycle detection
- import-linter integration
- CI integration
- Coupling metrics
- All settings
- File layout
pip install django-extensions grimpFor the Debug Toolbar panel (optional):
pip install django-debug-toolbarAdd to INSTALLED_APPS. django_extensions is required for model graph extraction; dependency_map itself has no models and needs no migrations:
INSTALLED_APPS = [
    ...
    "django_extensions",
    "dependency_map",
]
TEMPLATES must include APP_DIRS: True (or equivalent loaders config) so Django can find the panel template:
TEMPLATES = [
    {
        "BACKEND": "django.template.backends.django.DjangoTemplates",
        "APP_DIRS": True,
        ...
    }
]python manage.py dependency_map --openThis runs the full analysis and opens the result in your browser. On first run against a large project it may take 5–10 seconds; subsequent runs with the same code are fast because grimp caches the import graph.
# Full project — auto-detects root package from ROOT_URLCONF
python manage.py dependency_map --open

# Specific apps only
python manage.py dependency_map billing users core ledger

# Explicit root package (required when ROOT_URLCONF can't be used to infer it)
python manage.py dependency_map --root-package myproject

# Multiple root packages (monorepo / shared library pattern)
python manage.py dependency_map --root-package myproject --root-package shared

# Write to a specific path
python manage.py dependency_map --output docs/architecture/deps.html --open

# JSON output — pipe to jq or other tooling
python manage.py dependency_map --format json > depmap.json
python manage.py dependency_map --format json | jq '.stats'
python manage.py dependency_map --format json | jq '[.cycles[] | select(.kind == "import")]'

# CI mode — exits 1 if any violations or cycles are found
python manage.py dependency_map --check

# Disable auto-loading of .importlinter contracts
python manage.py dependency_map --no-importlinter

# Mark a specific import as a violation (stacks on top of .importlinter)
python manage.py dependency_map --violation billing:users --violation payments:core

# Custom page title
python manage.py dependency_map --title "Hamilton Rock — Architecture"When --root-package is not specified, the command derives it from ROOT_URLCONF. For example, ROOT_URLCONF = "myproject.urls" gives myproject as the root package. For projects where apps live under a subdirectory (e.g. apps/billing/) set ROOT_URLCONF = "apps.urls" or pass --root-package apps explicitly.
If your app_label in each app's AppConfig includes the root package prefix (e.g. apps_billing for an app at apps/billing/), the analyzer normalises these automatically so that grimp and graph_models results map to the same app name.
Mounts the dependency map as a URL in your project so it can be visited in the browser and refreshed without re-running the management command.
1. Add to your URLconf:
# myproject/urls.py
from django.urls import include, path

urlpatterns = [
    ...
    path("__depmap__/", include("dependency_map.urls")),
]
2. Visit /__depmap__/ — staff-only by default (see settings below).
The page includes a ↻ refresh button that re-runs the full analysis without a page reload. The graph, filters, zoom level, and layout mode are all preserved across refreshes.
| URL | Description |
|---|---|
GET /__depmap__/ |
Full interactive HTML page |
GET /__depmap__/refresh/ |
JSON endpoint — returns fresh graph data, called by the refresh button |
Adds the dependency map as a panel in the Django Debug Toolbar, accessible on any page during development. No URLconf changes are needed — the panel registers its own endpoints under DjDT's URL prefix.
1. Add the panel to DEBUG_TOOLBAR_PANELS:
DEBUG_TOOLBAR_PANELS = [
    "debug_toolbar.panels.history.HistoryPanel",
    "debug_toolbar.panels.versions.VersionsPanel",
    "debug_toolbar.panels.timer.TimerPanel",
    "debug_toolbar.panels.settings.SettingsPanel",
    "debug_toolbar.panels.headers.HeadersPanel",
    "debug_toolbar.panels.request.RequestPanel",
    "debug_toolbar.panels.sql.SQLPanel",
    "debug_toolbar.panels.staticfiles.StaticFilesPanel",
    "debug_toolbar.panels.templates.TemplatesPanel",
    "debug_toolbar.panels.alerts.AlertsPanel",
    "debug_toolbar.panels.cache.CachePanel",
    "debug_toolbar.panels.signals.SignalsPanel",
    "debug_toolbar.panels.redirects.RedirectsPanel",
    "debug_toolbar.panels.profiling.ProfilingPanel",
    "dependency_map.panels.DependencyMapPanel",   # ← add this
]
2. That's it. The panel will appear in the toolbar on every page. Click it to open the full dependency map in the panel's content area.
The nav subtitle shows a live summary (22 apps · 3 cycles) once the cache is warm.
The panel renders an iframe that loads the full dependency map from /__debug__/depmap/. This provides complete isolation from the host page's CSS and JavaScript — D3 and the dark-themed layout don't interfere with your app's styles.
Analysis results are cached in process memory (default: 60 seconds) so reopening the panel is instant. The ↻ refresh button inside the map always runs a fresh analysis and updates the cache.
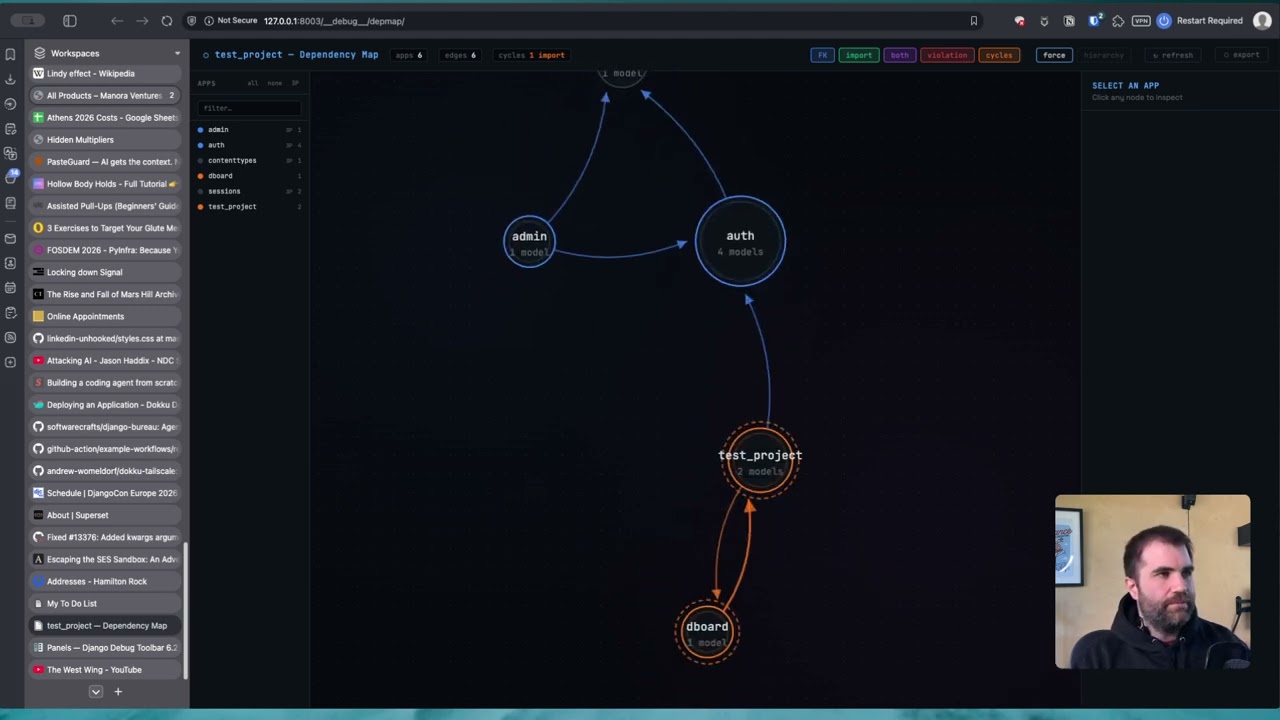
| Colour | Meaning |
|---|---|
| 🔵 Blue | FK / M2M relationship only (no code import) |
| 🟢 Green, dashed | Python import only (no data relationship) |
| 🟣 Purple | Both import + FK — the strongest coupling |
| 🔴 Red | import-linter violation |
| 🟠 Orange | Part of an import cycle |
| 🟡 Amber | Part of an FK cycle |
The ring colour around each node reflects the app's dominant outgoing coupling type, using the same colours as the edges. Apps in import cycles show an orange dashed halo; apps in FK cycles show an amber dotted halo. When an app is in both, the halos stack.
Two layout modes are available via the toggle in the top bar:
Force — D3 force-directed simulation. Nodes cluster by coupling strength, good for exploring an unfamiliar codebase.
Hierarchy — Dagre top-to-bottom layered layout. Stable leaf apps (shared core, accounts) sit at the top; apps that depend on everything sit at the bottom. Dependencies flow upward. Best for understanding architectural layers.
Click a node to highlight its connections and open the side panel. The side panel shows:
- Cycle membership, with an example path showing one real cycle route
- Direct mutual dependency pairs (the specific A↔B imports to fix first)
- Model list
- Afferent / efferent coupling counts and instability metric
- Full outgoing and incoming dependency list with coupling badges
Hover an edge for a tooltip showing the model-level FK field names and cycle/violation flags.
Filter buttons (top-right) toggle edge types on and off independently: FK, import, both, violation, cycles.
The app list on the left sidebar lets you show and hide individual apps. When you hide an app, the graph does not just remove the node — it recalculates the entire analysis for the visible subgraph:
- The force simulation or dagre layout reflows around the remaining nodes
- Cycle detection re-runs — if the hidden app was completing a cycle, the orange/amber halos disappear from the apps that are no longer mutually reachable
- Metrics update — afferent and efferent counts, instability, and direct pair lists all reflect only the visible apps
- Edge annotations update — edges that were part of a cycle through the now-hidden app lose their cycle colouring
This makes hide/show useful for diagnosing cycles: hide suspected load-bearing apps one at a time and watch whether the cycle indicator disappears from the remaining apps.
| Control | Action |
|---|---|
| Click an app name | Toggle that app's visibility |
| all button | Show all apps |
| none button | Hide all apps |
| 3P button | Toggle all third-party / Django built-in apps (allauth, django.contrib.*, etc.) |
| Search box | Filter the list by name |
Third-party apps are identified as apps that appear only as FK targets but are not found in your root_packages by grimp. They are marked with a small 3P badge in the sidebar.
Multiple hides are debounced — clicking several apps rapidly triggers one recalculation after the last click, not one per click.
The analyzer runs two independent passes of Tarjan's strongly connected component (SCC) algorithm:
Import cycles — circular Python imports. These are a runtime risk: if module A imports module B which imports module A before A has finished initialising, you get ImportError or partially initialised module bugs.
FK cycles — circular foreign key chains. These are valid at the database level but require careful ordering during migrations (--fake, SeparateDatabaseAndState, or deferred constraints).
Direct mutual pairs are the most actionable output. A direct pair A ↔ B means both A → B and B → A exist as direct edges, with no intermediate apps. These are where refactoring starts.
SCC label describes the full connected component — every app that can reach every other via some path. The label reads SCC of 14 apps: bank_account, business, ... and never uses → between members, because those arrows would imply direct edges that may not exist.
Example path is one real, verified shortest cycle through actual edges (found by BFS), labelled e.g. bank_account → cards → bank_account. This is clearly labelled as an example — not a complete description of the cycle.
✗ 22 direct mutual import(s) — fix these first:
  bank_account ↔ cards
  bank_account ↔ payment
  ...

✗ 1 import cycle group(s):
  SCC of 14 apps: bank_account, business, cards, ...
    e.g. bank_account → cards → bank_account

✗ 5 direct mutual FK(s) — migration ordering risk:
  bank_account ↔ cards
  feature_flags ↔ users
  ...
If a .importlinter or setup.cfg file with [importlinter:*] sections is present in the project root, violation contracts are loaded automatically and applied to the graph. Pass --no-importlinter to skip this.
Three contract types are supported:
layers — top-to-bottom hierarchy; any upward import is a violation:
[importlinter]
root_package = myproject

[importlinter:contract:layers]
name = App layer hierarchy
type = layers
layers =
    webhooks | notifications
    billing | treasury | issuing
    ledger
    accounts
    core
Pipe-separated names on the same line are peers at the same layer and may import each other freely.
independence — listed modules must not import each other at all:
[importlinter:contract:independence]
name = Webhooks and notifications are independent
type = independence
modules =
    myproject.webhooks
    myproject.notifications
forbidden — explicit forbidden import pairs:
[importlinter:contract:forbidden]
name = Core is a leaf module
type = forbidden
source_modules =
    myproject.core
forbidden_modules =
    myproject.billing
    myproject.accounts
pyproject.toml with [tool.importlinter] is also supported on Python 3.11+ (uses tomllib) or when tomli is installed.
# .github/workflows/ci.yml
- name: Check dependency violations and cycles
  run: python manage.py dependency_map --check
# Makefile
lint:
python manage.py dependency_map --checkThe command exits 0 when clean, 1 when violations or cycles are found. Stderr contains the structured report; stdout contains the summary counts.
The side panel shows three metrics for each app, calculated against the currently visible subgraph (i.e. they update when you hide apps):
| Metric | Formula | Interpretation |
|---|---|---|
| afferent coupling (Ca) | Apps that depend on this one | High = many dependents; risky to change |
| efferent coupling (Ce) | Apps this one depends on | High = many dependencies; fragile |
| instability | Ce / (Ca + Ce) | 0 = stable leaf, 1 = unstable top-level |
An app with high instability and high afferent coupling is the most dangerous to modify — it both depends on a lot and is depended upon by a lot. An app with low instability and no models is a candidate for extraction into a shared utilities package.
All settings are optional. Configure in settings.py:
# Root Python packages for grimp import analysis.
# Auto-detected from ROOT_URLCONF when not set.
# Required when apps live under a subdirectory (e.g. apps/billing/).
DEPENDENCY_MAP_ROOT_PACKAGES = ["apps"]

# Page title shown in the browser tab and the graph header.
# Defaults to "<project> — Dependency Map".
DEPENDENCY_MAP_TITLE = "Hamilton Rock — Dependency Map"

# Restrict the live view to staff users only (is_staff=True).
# Default: True. Set to False to allow any authenticated user.
# Take care in production — the analysis exposes your full project structure.
DEPENDENCY_MAP_STAFF_ONLY = True

# Seconds to cache analysis results in the Debug Toolbar panel.
# Default: 60. Set to 0 to re-analyse on every panel open.
DEPENDENCY_MAP_PANEL_CACHE_TTL = 60dependency_map/
├── __init__.py
├── apps.py # AppConfig — registers templates
├── analyzer.py # Merges graph_models + grimp → graph dict
├── cycles.py # Tarjan SCC + BFS shortest cycle
├── importlinter.py # .importlinter / setup.cfg contract parser
├── panels.py # Django Debug Toolbar panel (optional)
├── renderer.py # Graph dict → self-contained HTML/D3/dagre
├── urls.py # URL patterns for the live view
├── views.py # DependencyMapView + DependencyMapRefreshView
├── templates/
│ └── dependency_map/
│ └── panel.html # Debug Toolbar iframe wrapper
└── management/
└── commands/
└── dependency_map.py # Management command entry point
Drop the dependency_map/ directory next to your manage.py and add "dependency_map" to INSTALLED_APPS. No migrations are required — the app has no models.
- import-linter generation
- based on current/desired output?
- cycle breaker - from grimp
- import counts on the graph