Is powerful solutions for deploying applications and environments, independents on the operating systems. What's Docker?
For example - we have ready logging solutions based on Elasticsearch and Kibana. You don't nothing to install and configure - just run, as well as Selenium grid.
How to install Docker
Your tests must be executed in browser via Harness. Harness is test runner test, that uses webdriver for controlling of browsers and executing commands of tests based on Selenium.
Let's go run selenium grid via docker. Our goal is, run selenium in hub mode, which will be central point for incoming commands from webdriver. Next we must run selenium in node mode, which will be handle commands from selenium hub. Selenium node will be connect to. Selenium hub.
Run Selenium hub
$ docker run -d -p 4444:4444 --name selenium-hub -v /gridConfig/hub/config.json:/opt/selenium/config.json selenium/hub:2.50.0
Run Selenium node
$ docker run -d --link selenium-hub:hub -v /gridConfig/node/config.json:/opt/selenium/config.json selenium/node-firefox:2.50.0
That's all :-) You can check successful execution:
$ docker ps

CONTAINER ID        IMAGE                         COMMAND                  CREATED             STATUS              PORTS                    NAMES
0e4ff7cee132        selenium/node-firefox:2.50.0   "/opt/bin/entry_point"   3 seconds ago       Up 3 seconds                                              prickly_turing
649ee95b2dd7        selenium/hub:2.50.0            "/opt/bin/entry_point"   2 minutes ago       Up 2 minutes        0.0.0.0:4444->4444/tcp                selenium-hub
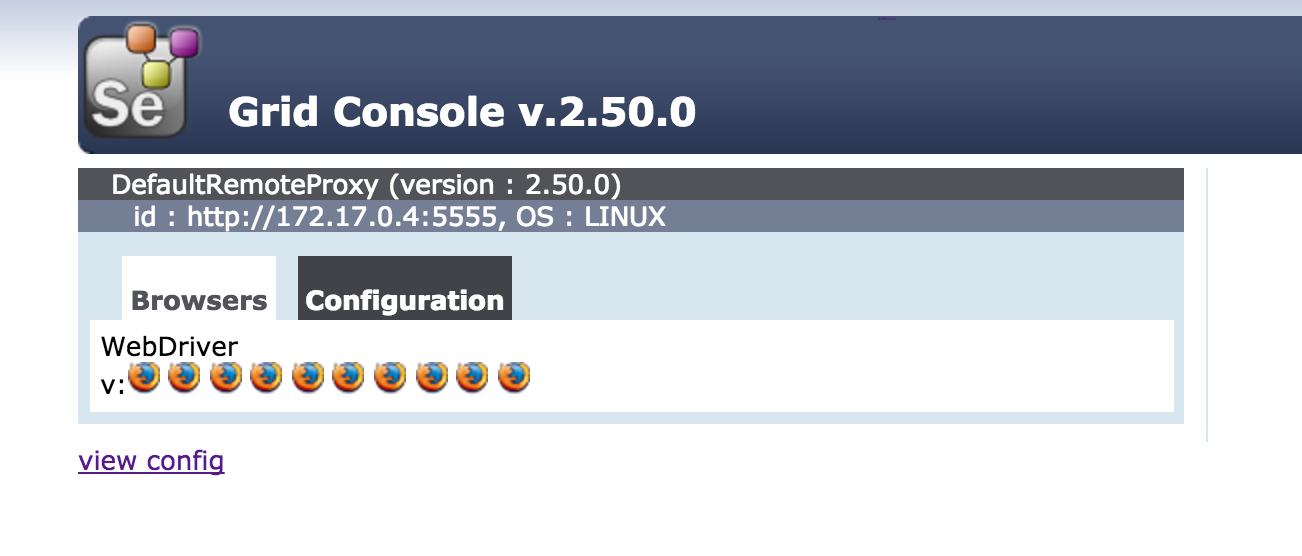
Or via browser http://localhost:4444/grid/console. You see grid console with one registerd node.
Docker compose
move to /docker/dockerComposes/seleniumGrid/ and run docker-compose up -d
** Selenium grid nodes** Now we have one hub and one node. We can see on stdout of selenium-hub container about details:
$docker logs selenium-hub

...
09:10:33.466 INFO - Nodes should register to http://172.17.0.54:4444/grid/register/
09:10:33.466 INFO - Selenium Grid hub is up and running
09:10:56.718 INFO - Registered a node http://172.17.0.55:5555
09:28:15.431 INFO - Registered a node http://172.17.0.56:5555
09:28:16.736 INFO - Registered a node http://172.17.0.57:5555
09:28:17.604 INFO - Registered a node http://172.17.0.58:5555
We use a ready-made images
From Geoff Bourne We thank him.
Your goal is as follows. Store logs of tests to ElasticSearch and display results in Kibana. First you have to run ElasticSearch and then Kibana. You can just run container with Elasticsearch & Kibana and when stop or kill those containers - you lose their stored data and optional configuration. You must make directory ~/data and ~/conf with sufficient rights for persist data and configuration.
Copy elasticsearch.yml and logging.yml to ~/conf directory.
Run Elasticsearch
$ docker run -d --name elastic -p 9200:9200 -p 9300:9300 -v ~/data:/data -v ~/conf:/conf itzg/elasticsearch
or with Elastic HQ plugin
$ docker run -d --name elastic -e PLUGINS=royrusso/elasticsearch-HQ -p 9200:9200 -p 9300:9300 -v ~/data:/data -v ~/conf:/conf itzg/elasticsearch
You can check successful execution:
$ docker ps elastic
CONTAINER ID        IMAGE                COMMAND             CREATED              STATUS              PORTS                                            NAMES
ed33ce0515dd        itzg/elasticsearch   "/start"            About a minute ago   Up About a minute   0.0.0.0:9200->9200/tcp, 0.0.0.0:9300->9300/tcp   elastic
Start ElasticSearch takes a few seconds. Verify that ElasticSearch runs, as follows:
$ curl localhost:9200

{
  "status" : 200,
  "name" : "Crippler",
  "cluster_name" : "harness",
  "version" : {
    "number" : "1.7.0",
    "build_hash" : "929b9739cae115e73c346cb5f9a6f24ba735a743",
    "build_timestamp" : "2015-07-16T14:31:07Z",
    "build_snapshot" : false,
    "lucene_version" : "4.10.4"
  },
  "tagline" : "You Know, for Search"
}
If you need to stop Elasticsearch container, can as follows docker stop elastic and then run again docker start elastic. If you change the configuration file in /data/elasticsearch.yml - for apply the configuration changes, you must restart container docker restart elastic.
Run Kibana
$ docker run -d --name kibana -p 5601:5601 --link elastic:es itzg/kibana
You can check successful execution.
$ docker ps

CONTAINER ID        IMAGE                COMMAND             CREATED             STATUS              PORTS                                            NAMES
c4013f8a7ea2        itzg/kibana          "/start"            3 seconds ago       Up 2 seconds        0.0.0.0:5601->5601/tcp                           kibana
f370a70eff0a        itzg/elasticsearch   "/start"            10 minutes ago      Up 10 minutes       0.0.0.0:9200->9200/tcp, 0.0.0.0:9300->9300/tcp   elastic
And in your browser http://localhost:5601/
Download
sudo curl -L -O https://github.com/docker/compose/releases/download/1.4.2/docker-compose-`uname -s`-`uname -m`
Docker Compose for SeleniumGrid & Logstash
logstash:
  image: itzg/logstash:latest
  ports:
    - "25826:25826/udp"
  volumes:
    - /home/rdpanek/logstashConf/:/conf
seleniumHub:
  image: selenium/hub:2.47.1
  ports:
    - "4444:4444"
  environment:
    - GRID_BROWSER_TIMEOUT=12000
    - GRID_MAX_SESSION=30
seleniumNode:
  image: selenium/node-chrome:2.47.1
  links:
    - seleniumHub
docker-compose up -d