A simple module for reading and writing iMOD IDF files. IDF is a simple binary format used by the iMOD groundwater modelling software.
The format contains:
- A header with grid and spatial extent information.
- An array of floats.
The array of floats is translated to a rectangular grid using the ncol and nrow fields of the header. The IDF format contains no spatial reference. It is projection unaware.
When writing IDF files with Idfpy, the fields dmin, dmax, xmax and ymax in the IDF header are updated using the actual values of the IDF data array.
This package is not yet published. In the meanwhile, use pip:
pip install git+https://github.com/tomvansteijn/idfpy.git
python setup.py install
Installation requires Python 3+ and Numpy. Pytest is required for testing.
Example:
import idfpy

with idfpy.open('bxk1-d-ck.idf') as src:
    bxk1d = src.read(masked=True)

print('bxk1d mean: {:.1f}'.format(bxk1d.mean()))
print('bxk1d coverage: {:.1f}%'.format(
    (1 - bxk1d.mask.sum() / bxk1d.mask.size) * 1e2
    ))
Files can also be sampled using a sequence of X, Y coordinates:
import idfpy

coords = [(255_872., 485_430.), ]
with idfpy.open('bxk1-d-ck.idf') as src:
    values = [v[0] for v in src.sample(coords)]

print(values)
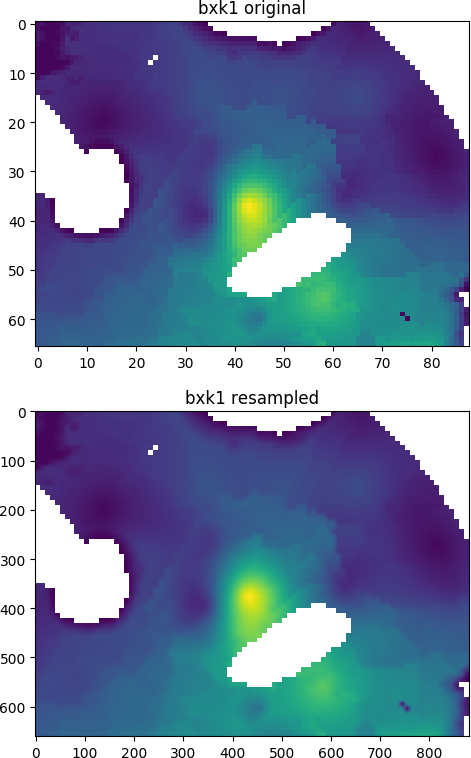
IDF arrays can also be shifted, resampled or reprojected using Rasterio:
import idfpy

from matplotlib import pyplot as plt
from rasterio import Affine
from rasterio.crs import CRS
from rasterio.warp import reproject, Resampling
import numpy as np

with idfpy.open('bxk1-d-ck.idf') as src:
    a = src.read(masked=True)
    nr, nc = src.header['nrow'], src.header['ncol']
    dx, dy = src.header['dx'], src.header['dy']
    src_transform = Affine.from_gdal(*src.geotransform)

# define new grid transform (same extent, 10 times resolution)
dst_transform = Affine.translation(src_transform.c, src_transform.f)
dst_transform *= Affine.scale(dx / 10., -dy / 10.)

# define coordinate system (here RD New)
src_crs = CRS.from_epsg(28992)

# initialize new data array
b = np.empty((10*nr, 10*nc))

# reproject using Rasterio
reproject(
    source=a,
    destination=b,
    src_transform=src_transform,
    dst_transform=dst_transform,
    src_crs=src_crs,
    dst_crs=src_crs,
    resampling=Resampling.bilinear,
    )

# result as masked array
b = np.ma.masked_equal(b, a.fill_value)

# plot images
fig, axes = plt.subplots(nrows=2, ncols=1)
axes[0].imshow(a.filled(np.nan))
axes[0].set_title('bxk1 original')
axes[1].imshow(b.filled(np.nan))
axes[1].set_title('bxk1 resampled')
plt.show()
Result: