Information Visualization MOOC project page.
This project collects some sample visualizations for the final course's project:
"Synthesizing spatial diet data of fishes from the Gulf of Mexico"
heatmap.html contains html and javascript code for the heatmap visualizations of preys and observations.
To switch from one to the other, you can add the measure parameter to the url.
So heatmap.html?measure=preys will show the preys heatmap, while heatmap.html?measure=preds will show the observations heatmap, the default is preys.
hexmap.html contains the previous maps with a panel that lets you select which one to show, plus an hexagonal grid that divides the Gulf of Mexico area in the sectors used for the circos visualizations described below.
The project and the visualizations are on gitpages.
- Home page: http://trainormg.github.io/ivmooc/
- Observations heatmap: http://trainormg.github.io/ivmooc/heatmap.html?measure=preds
- Preys heatmap: http://trainormg.github.io/ivmooc/heatmap.html?measure=preys
- Both heatmaps and hexagonal: http://trainormg.github.io/ivmooc/hexmap.html
The visualizations use the StyledMarker javascript library from https://code.google.com/p/google-maps-utility-library-v3/wiki/Libraries. Many thanks to the authors.
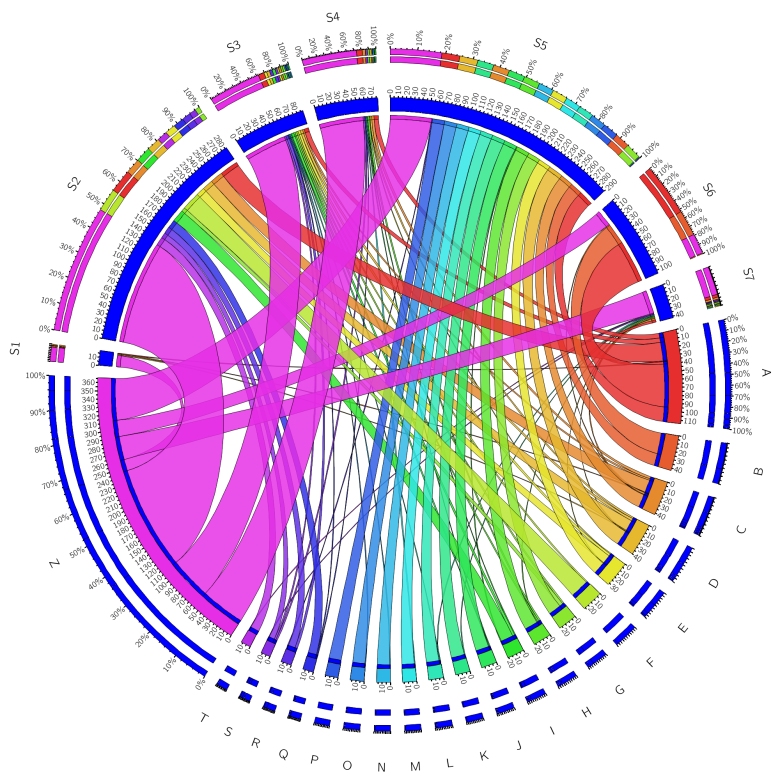
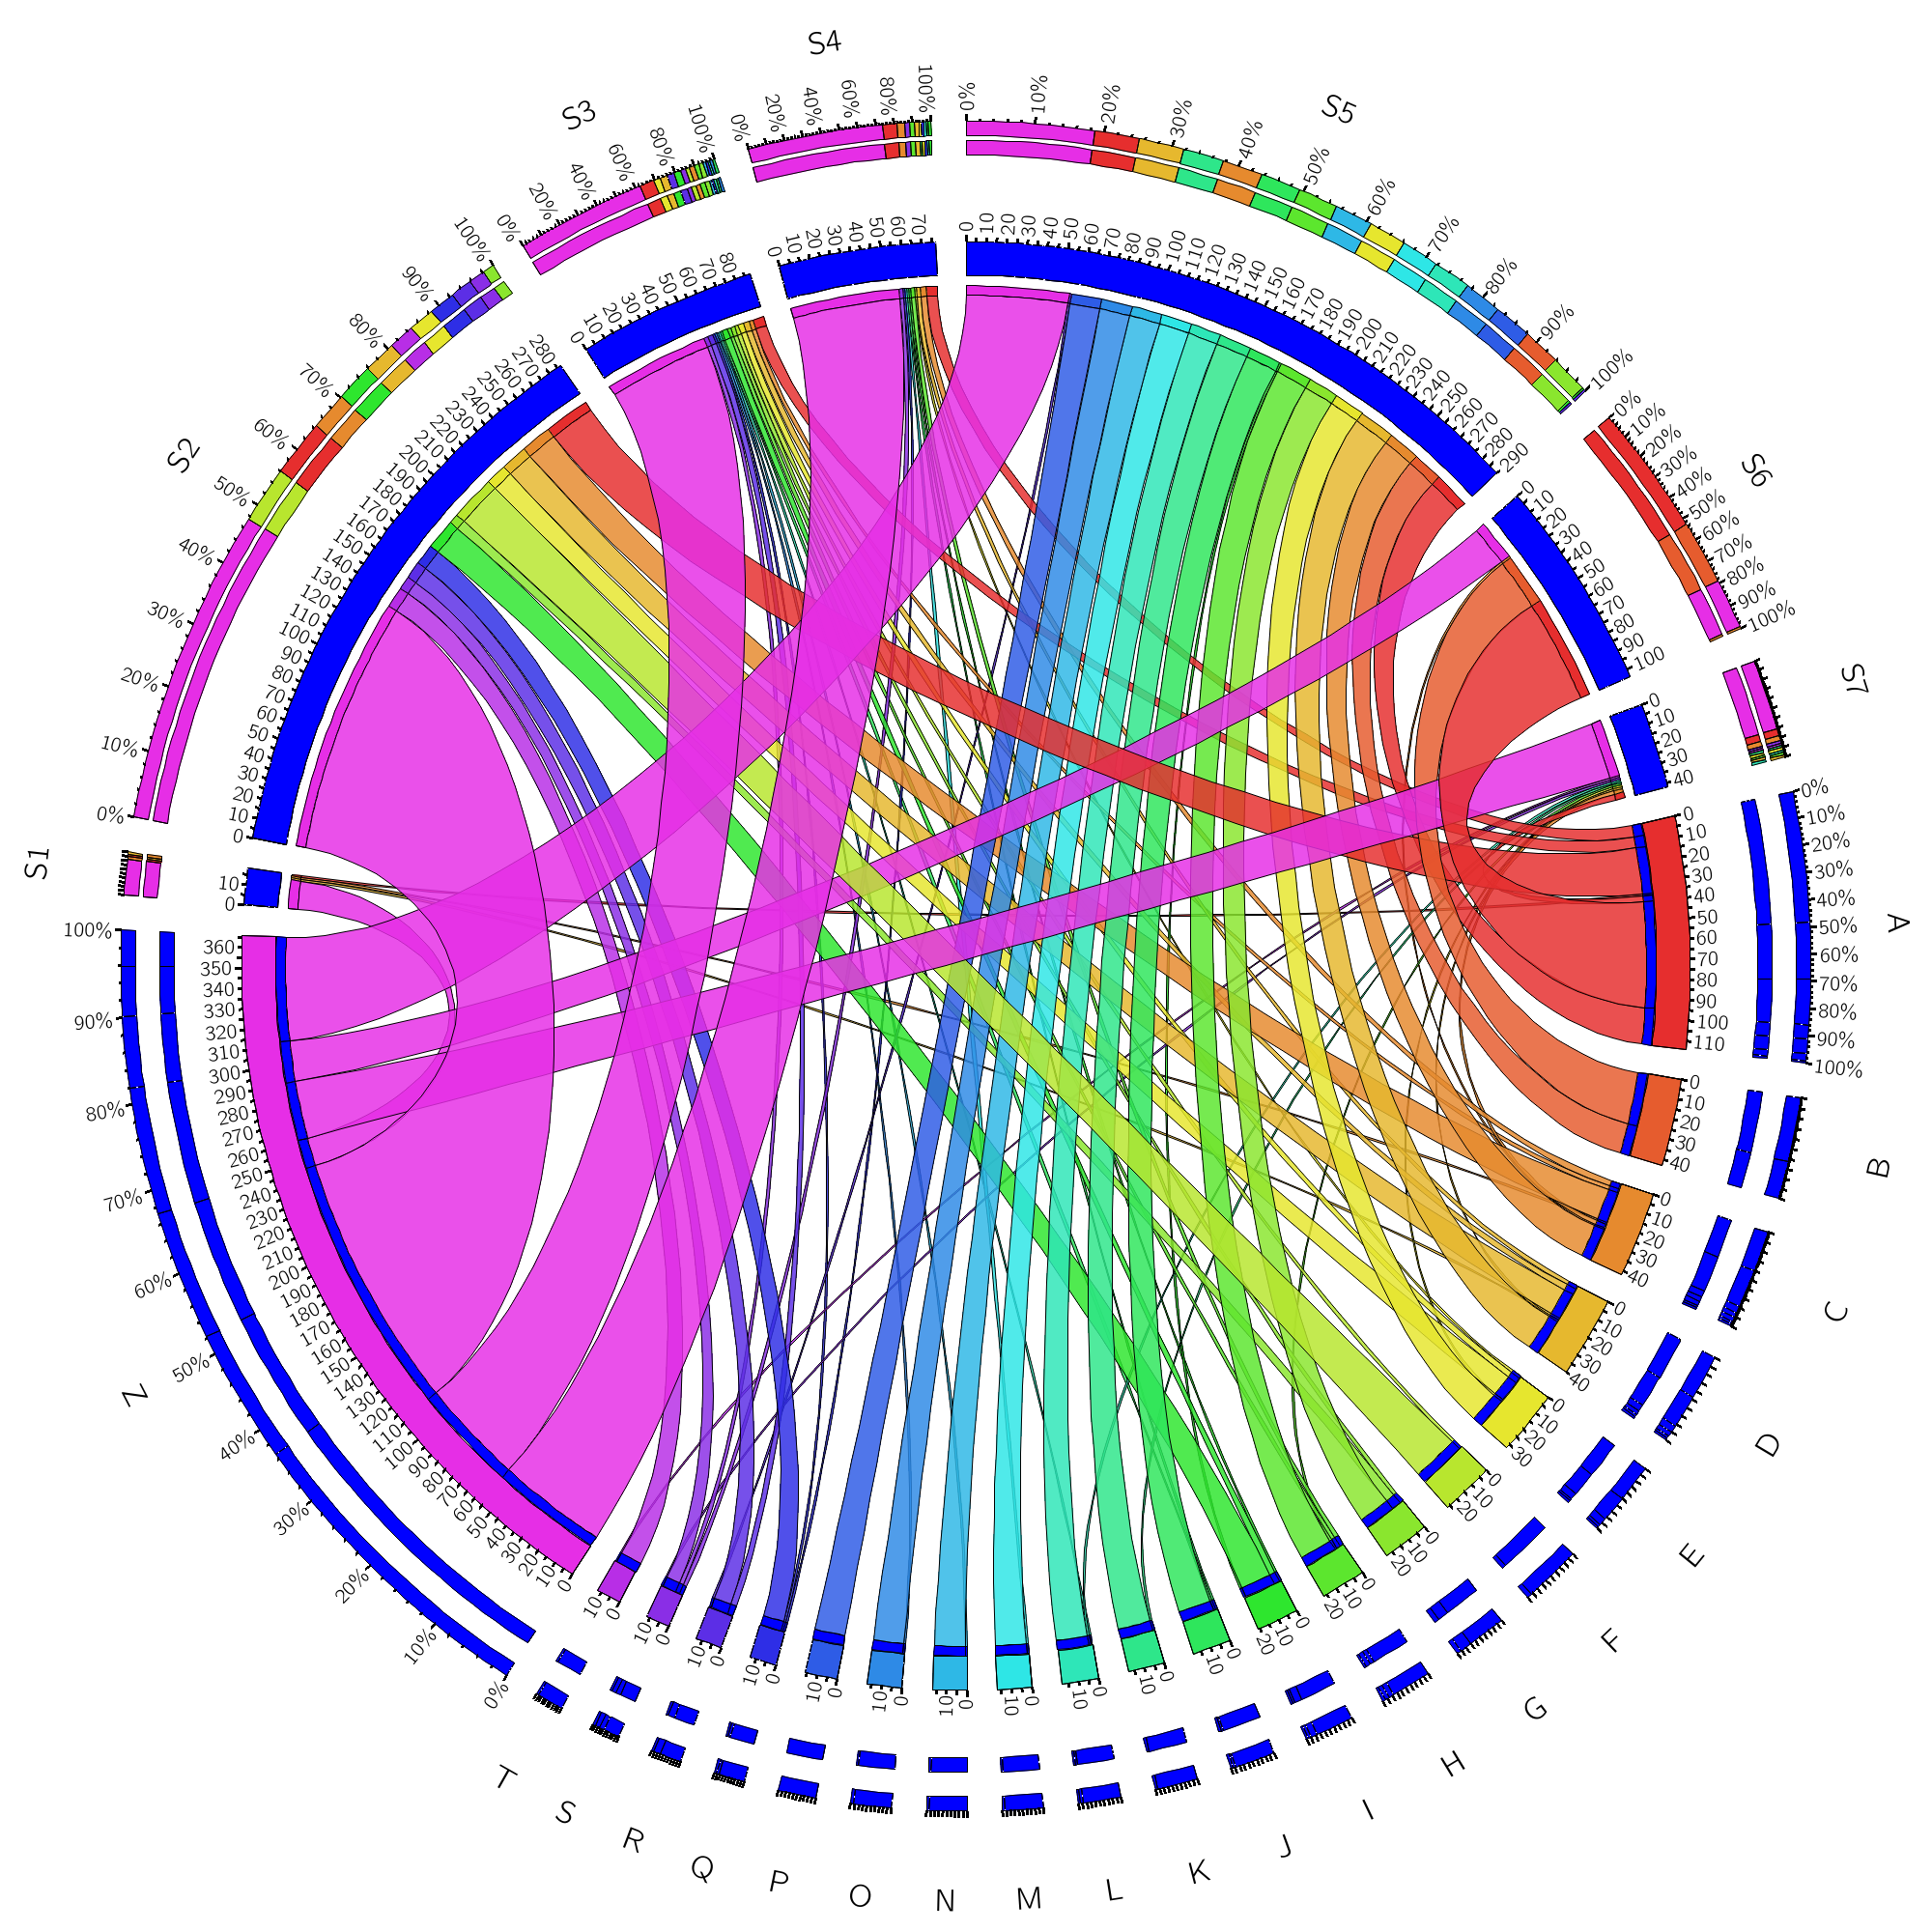
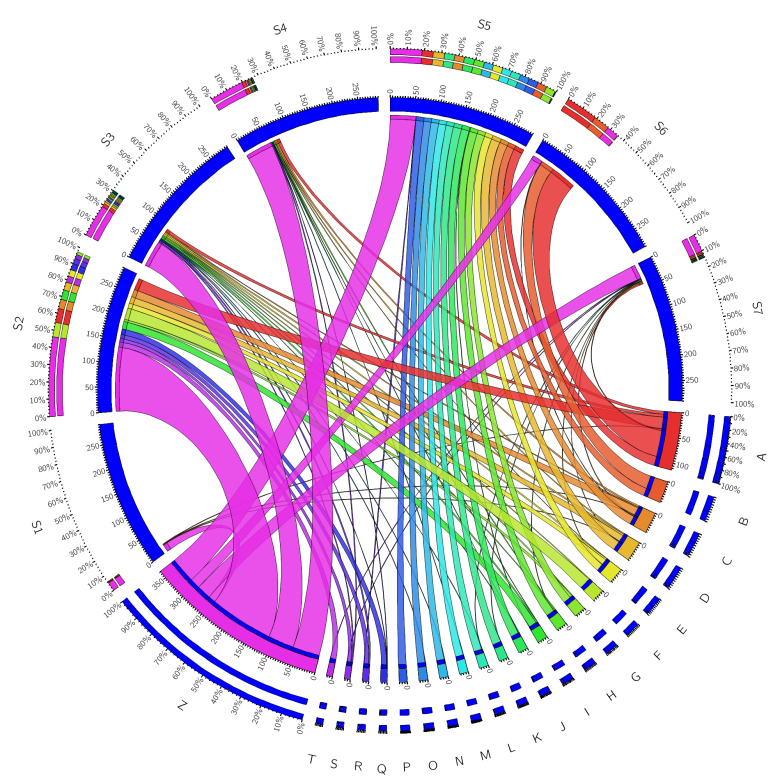
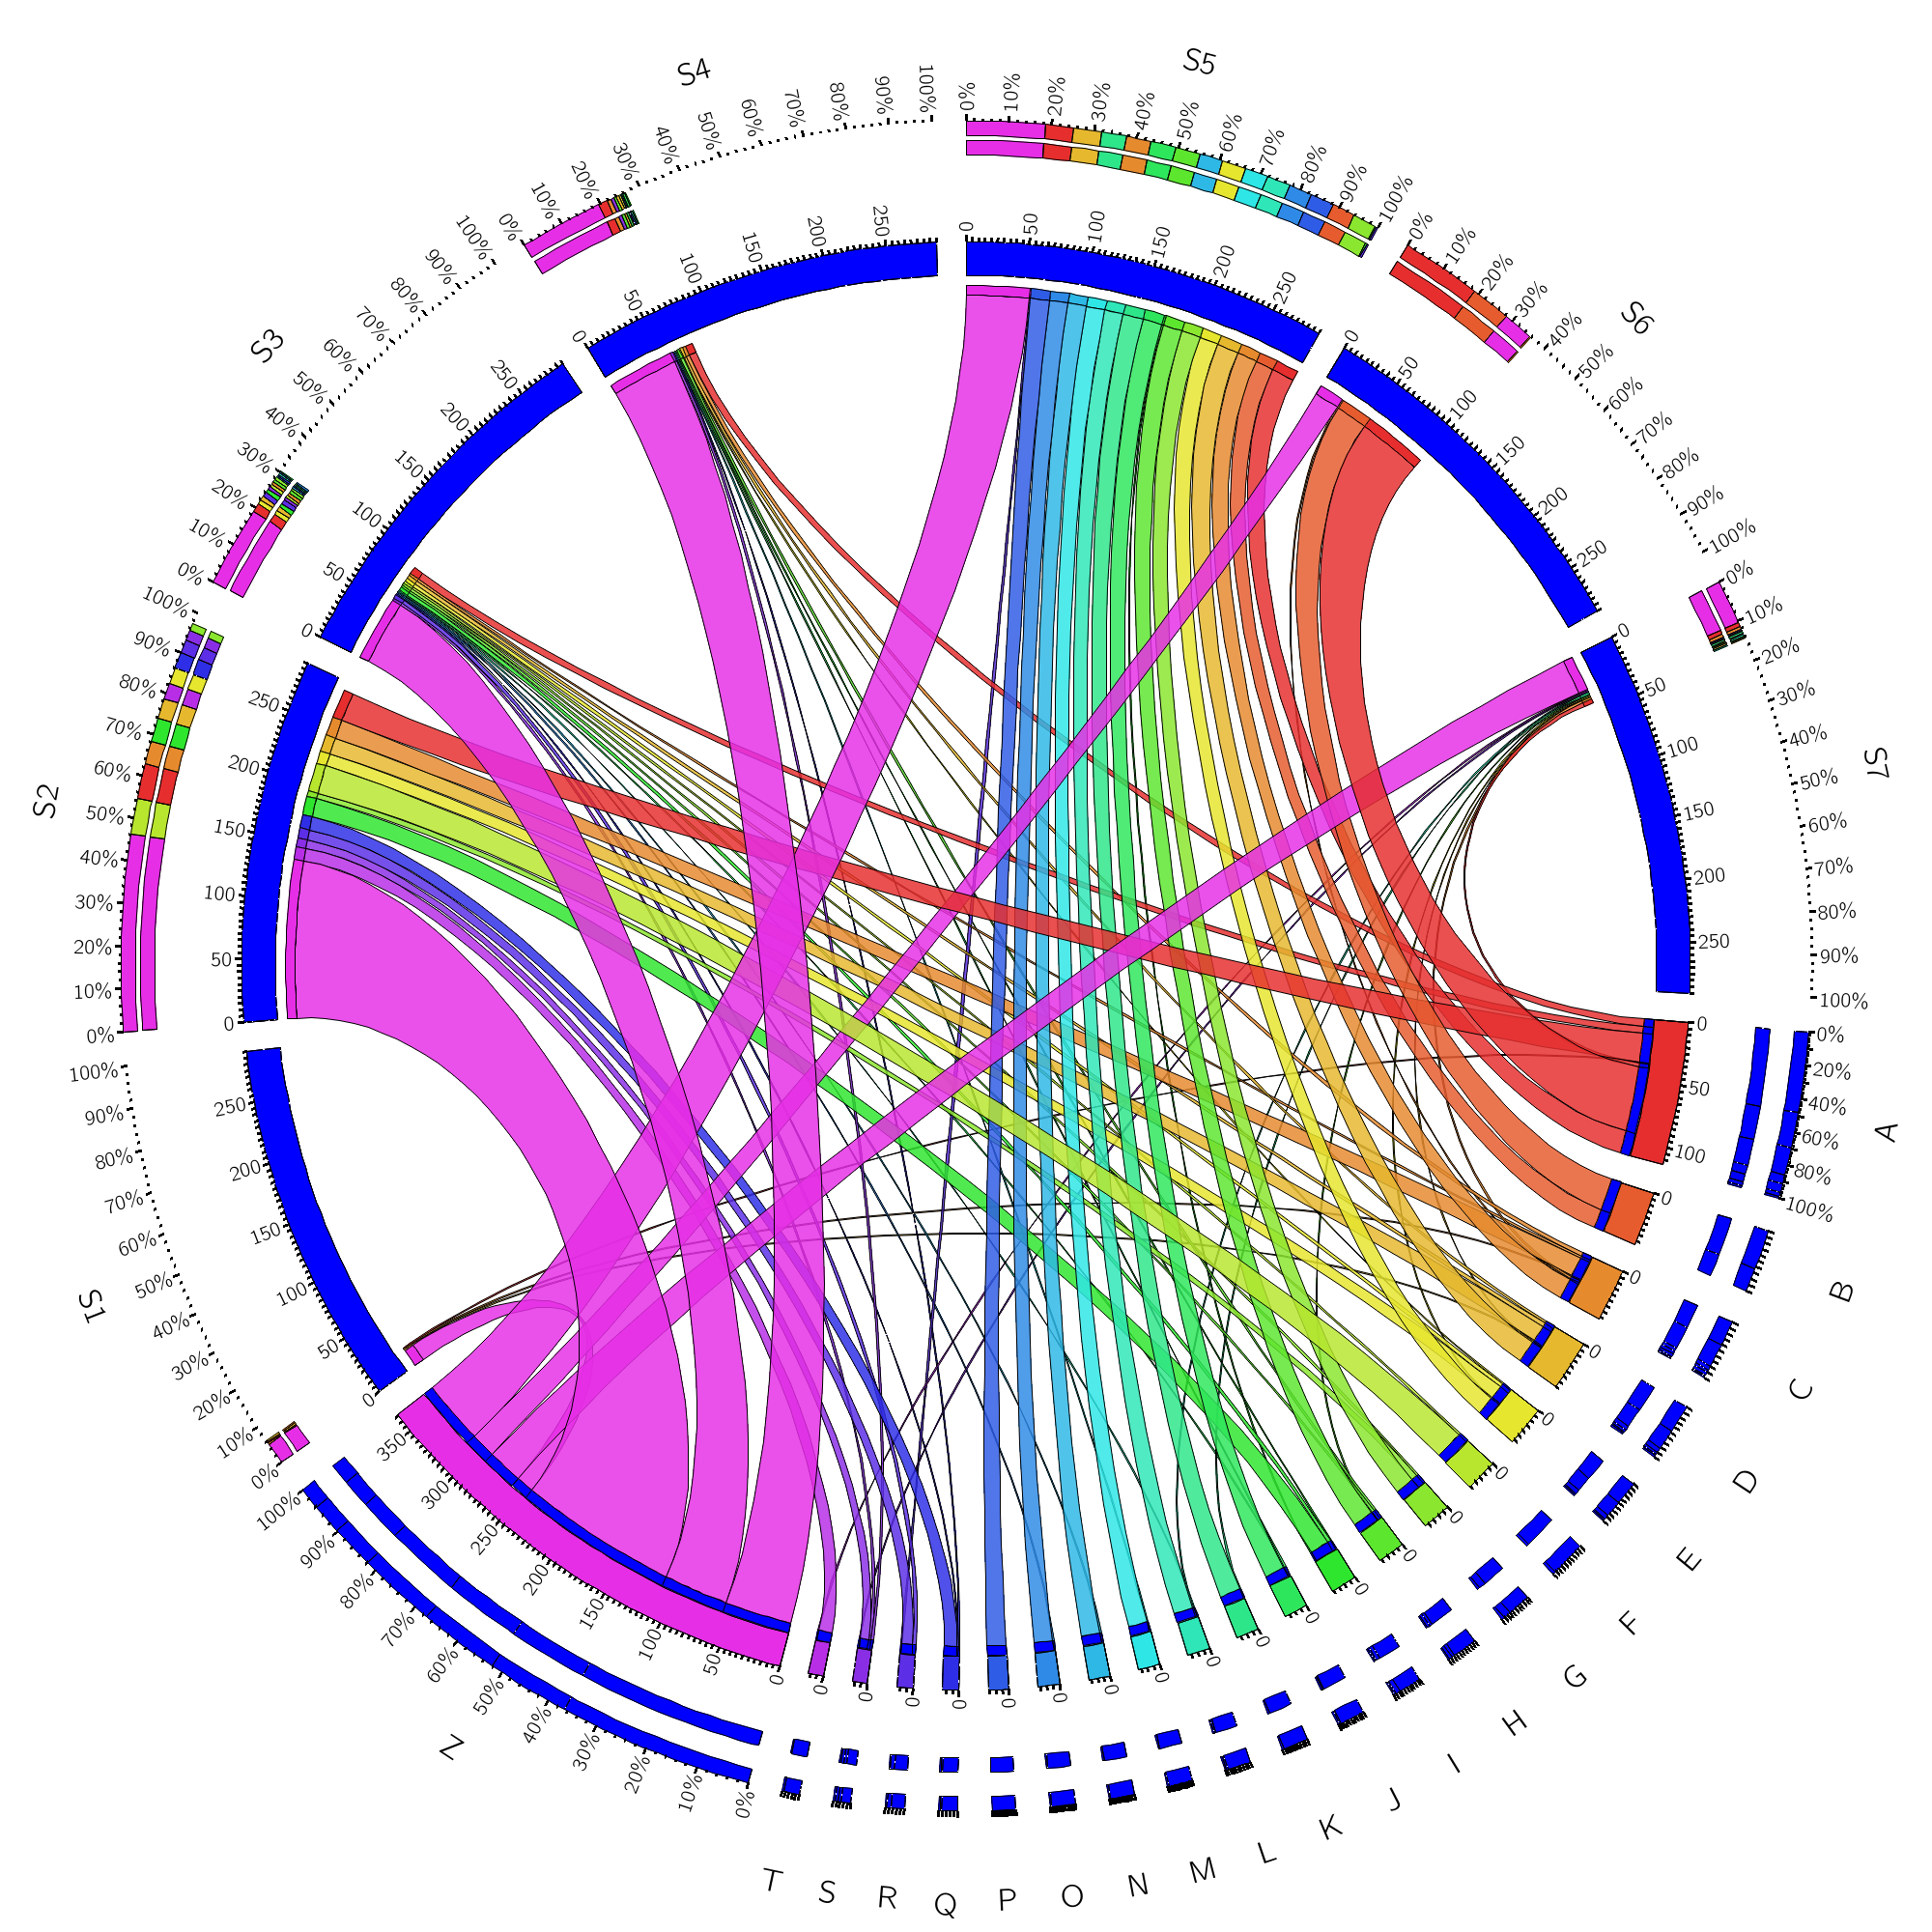
In the circos folder there are some sample visualizations of the scomberomorus cavalla preys data created using circos,
specifically the tabular data visualization online tool you can find at http://mkweb.bcgsc.ca/tableviewer/visualize/.
The visualization includes only the first 20 most common preys, all the others being grouped under an "others" category.
Sectors are shown as blue bars, while the species are automatically rendered in different colours.
Species names are labelled from A to T, Z stand for "others".
Sectors are the same as in the google map visualization above, are labelled from S1 to S7 and are placed in the same order as on the map.
- Blue sectors, sized by the number of observations they contain, in circos/circos01:
- Blue sectors, all sectors of the same size, in circos/circos02:
Species labels:
| Label | Species |
|---|---|
| A | Actinopterygii |
| B | Detritus |
| C | Clupeidae |
| D | Teuthida |
| E | Penaeidae |
| F | Caridea |
| G | Invertebrata |
| H | Carangidae |
| I | Brevoortia |
| J | Opisthonema oglinum |
| L | Harengula jaguana |
| K | Haemulidae |
| O | Triglidae |
| N | Sparidae |
| M | Lutjanidae |
| P | Pectinidae |
| R | Micropogonias undulatus |
| Q | Brachyura |
| T | Sciaenidae |
| Z | others |
The data used for all of the visualizations is in the excel file in the data folder.