Conversation
@jwildfire I had issue installing devtools::install_github("safetyGraphics/safetyCharts"), it complained "object 'nep_explorer_data' not found". There is some test code in R_old that requires this test data but not included. Was able to install a local branch after removing "R_old" |
Co-authored-by: Xiao Ni <mooncase@gmail.com>
@xni7 I just added R_Old to .rbuildignore in safetycharts. I'm able to build ok here, but wasn't getting that bug before either, so let me know if that fixes the issue on your end. |
…yGraphics/safetyGraphics into module-renderer
it installs okay now |
|
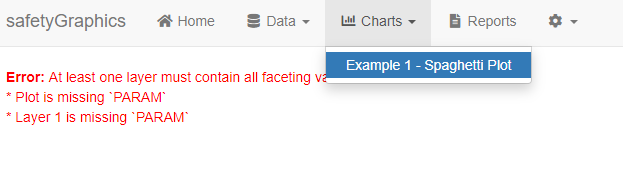
@jwildfire , couldn't get Example 1 - Static Outlier Explorer working. Seems to have do with the ggplot aes mapping.
|
Hm, seems like a data issue ... Is there any detail in the R log? I'm going to fix the data preview section now so that this will be easier to debug. |
Right now, the workflow is to load your data in R and then pass it in to the safetyGraphics app like so: Eventually we want to create a helper app/plugin/widget that allows non-technical users to load data (and apply other customizations) via a simple GUI. This will likely look at least a little bit like Bo's shinymeta workflow. This is tracked in #427 so we can discuss details there. |
Updated now. Can you check your labs data and confirm that it is showing up as expected and has a column called "PARAM" |
I was able to open the app (woohoo!) and I wanted to try this alternative you posed, @jwildfire but I don't see this function anywhere when I look using |
@MayaGans It was a typo. I meant @xni7 this is the current workflow for adding custom charts to the defaults found in safetyCharts. |
Update imports and documentation
|
Oops - merging before closing ... |
Overview
This branch refactors the process for adding custom charts and reimplements shiny module renderers. See the draft of the new Custom Chart Vignette for details about the new process.
Details
The biggest change is that chart configuration information has been migrated from
raw-data/charts.csvto a series of yaml files. The yaml files are currently saved ininst/config/charts, but will be migrated to the safetyCharts package in the near future. Detailed documentation of the YAML format is saved in this wiki page, which will be adapted in to a vignette before the v2 release.Test notes
Checkout the branch and then run this code to start the app.
Just load the package and run
safetyGraphicsApp()like normal. You can also runmakeChartConfig()directly to easily create a list of charts from the YAML files saved in a set of directories.