/area monitoring
/kind bug
Potentially the same as #4167 #4229 #4507.
I just installed Knative serving v0.11.0 with monitoring.yaml. I used istio-lean instuctions from here to install Istio from HEAD (near 1.4.2).
It seems most of the useful Grafana dashboards are broken.
(If so, please consider taking Grafana out of docs for now. If it's broken for 6 months, no point of documenting it as if it's working.)
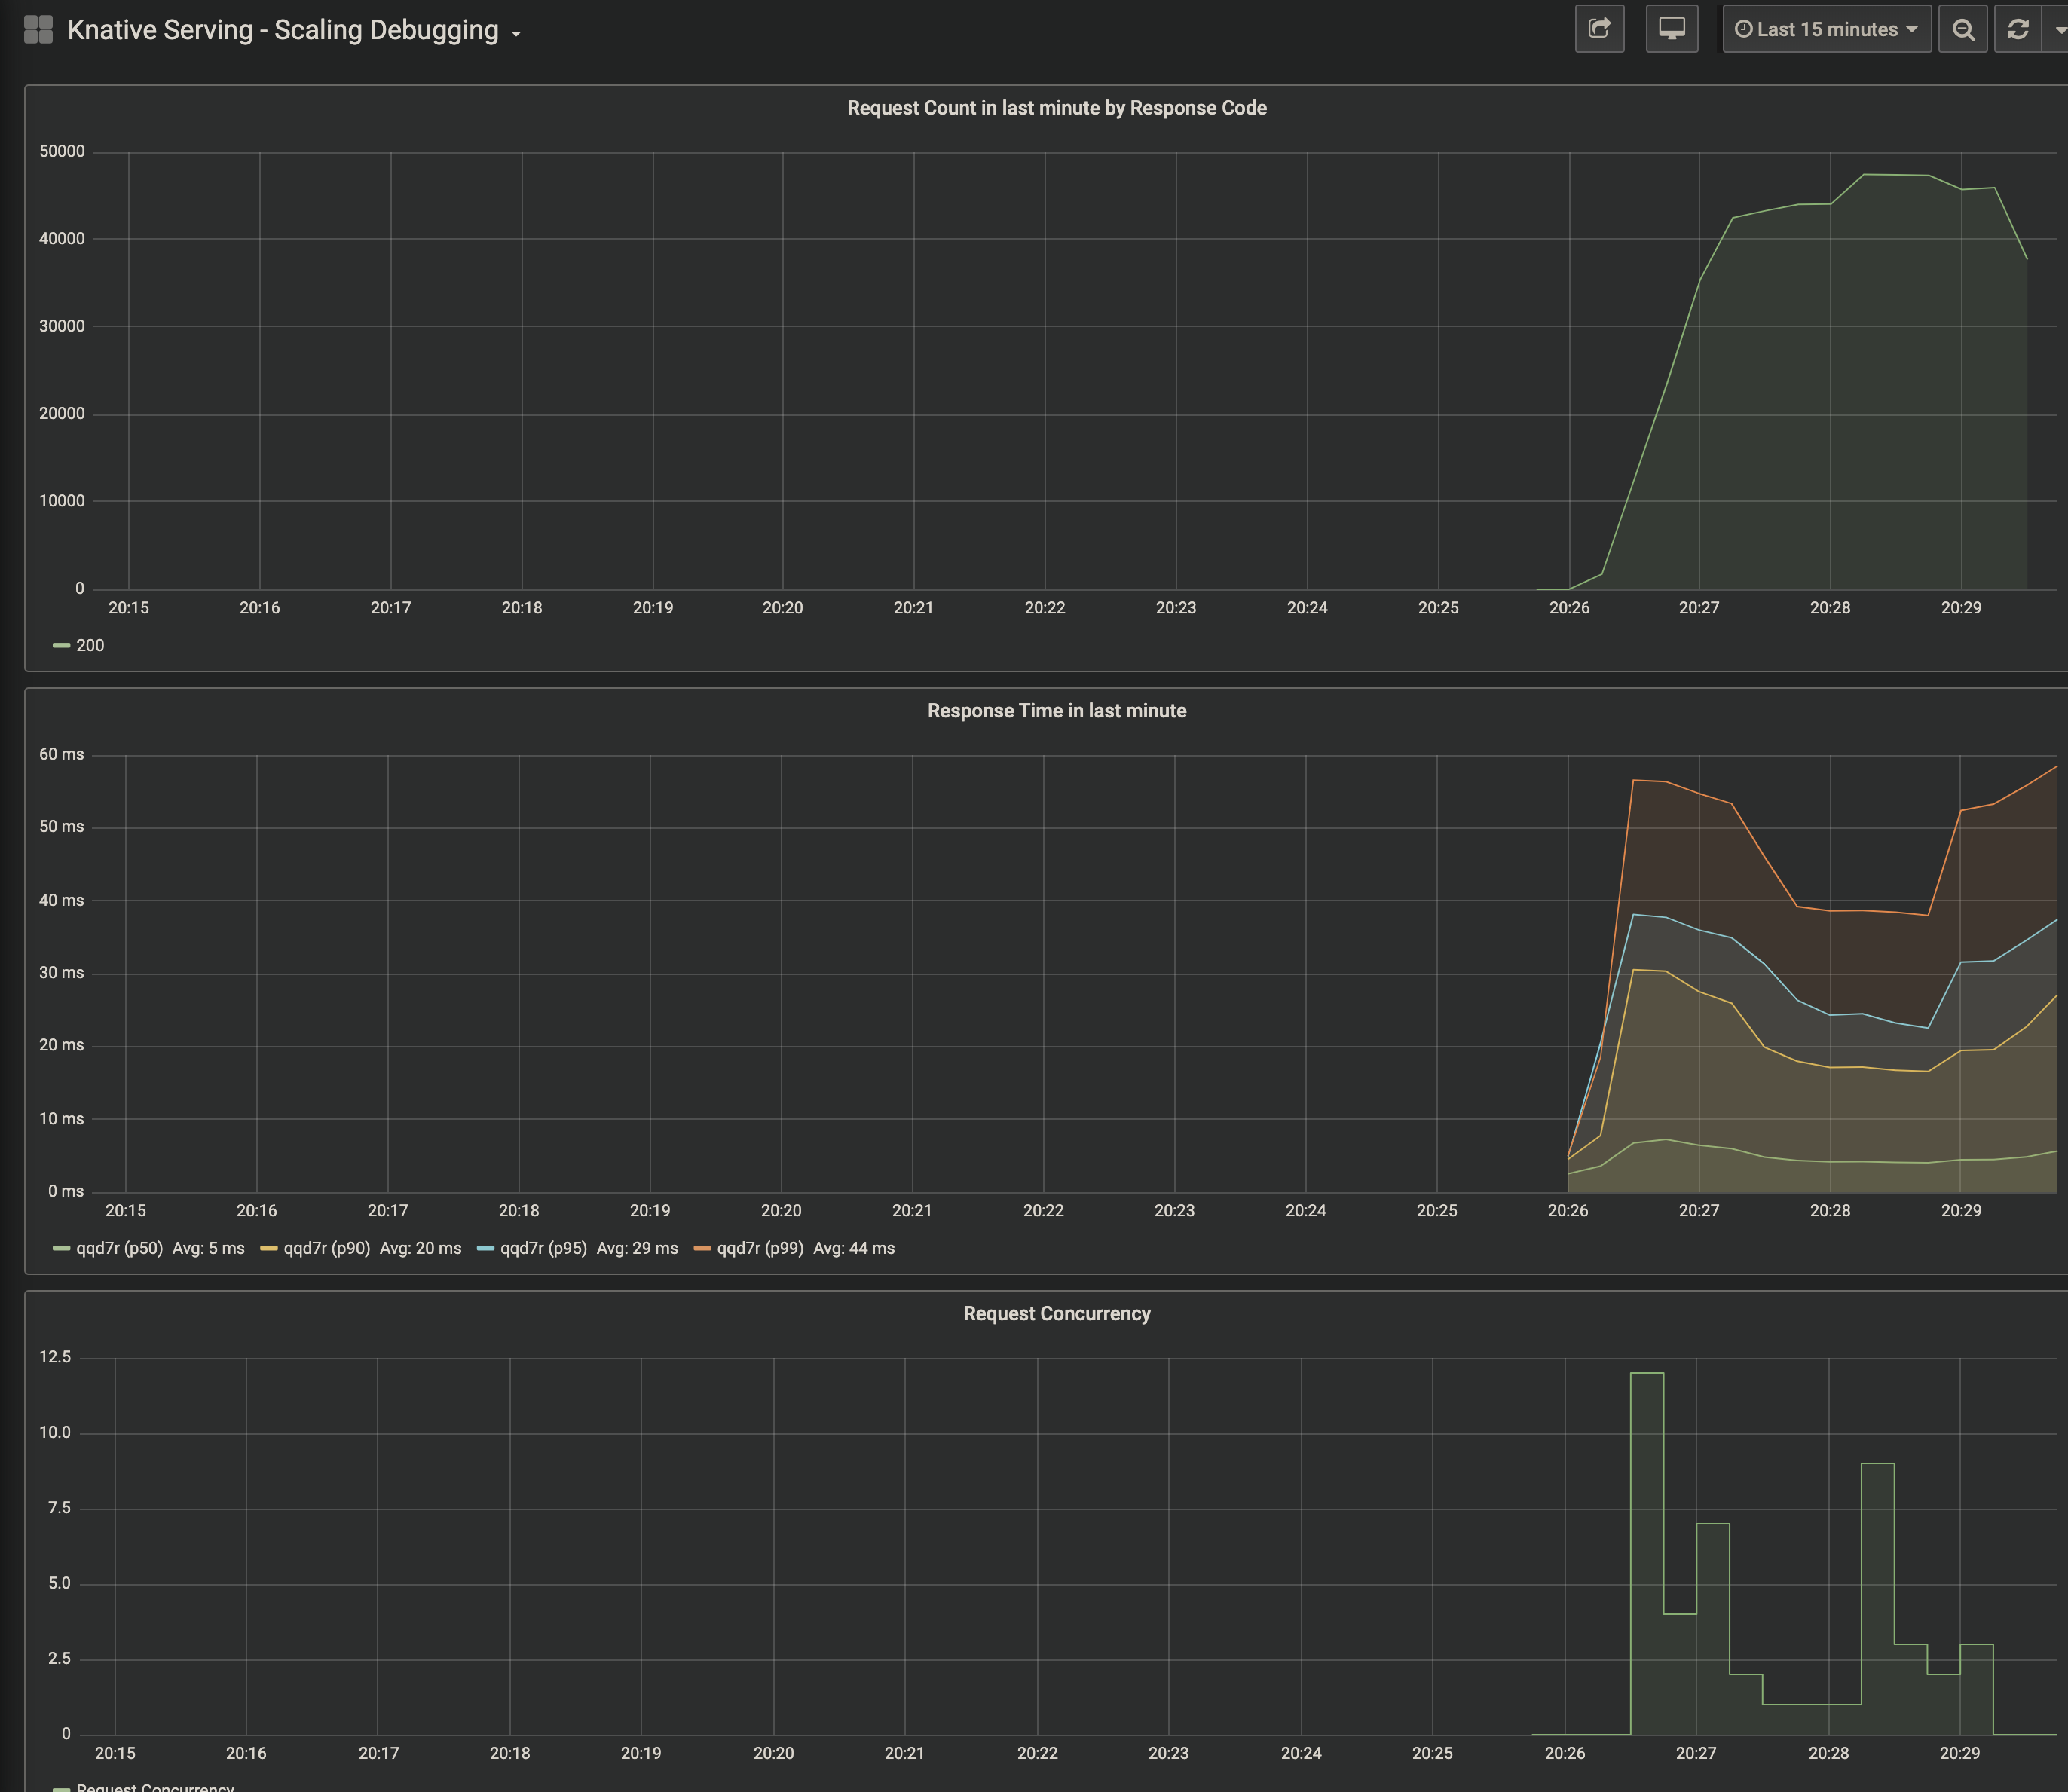
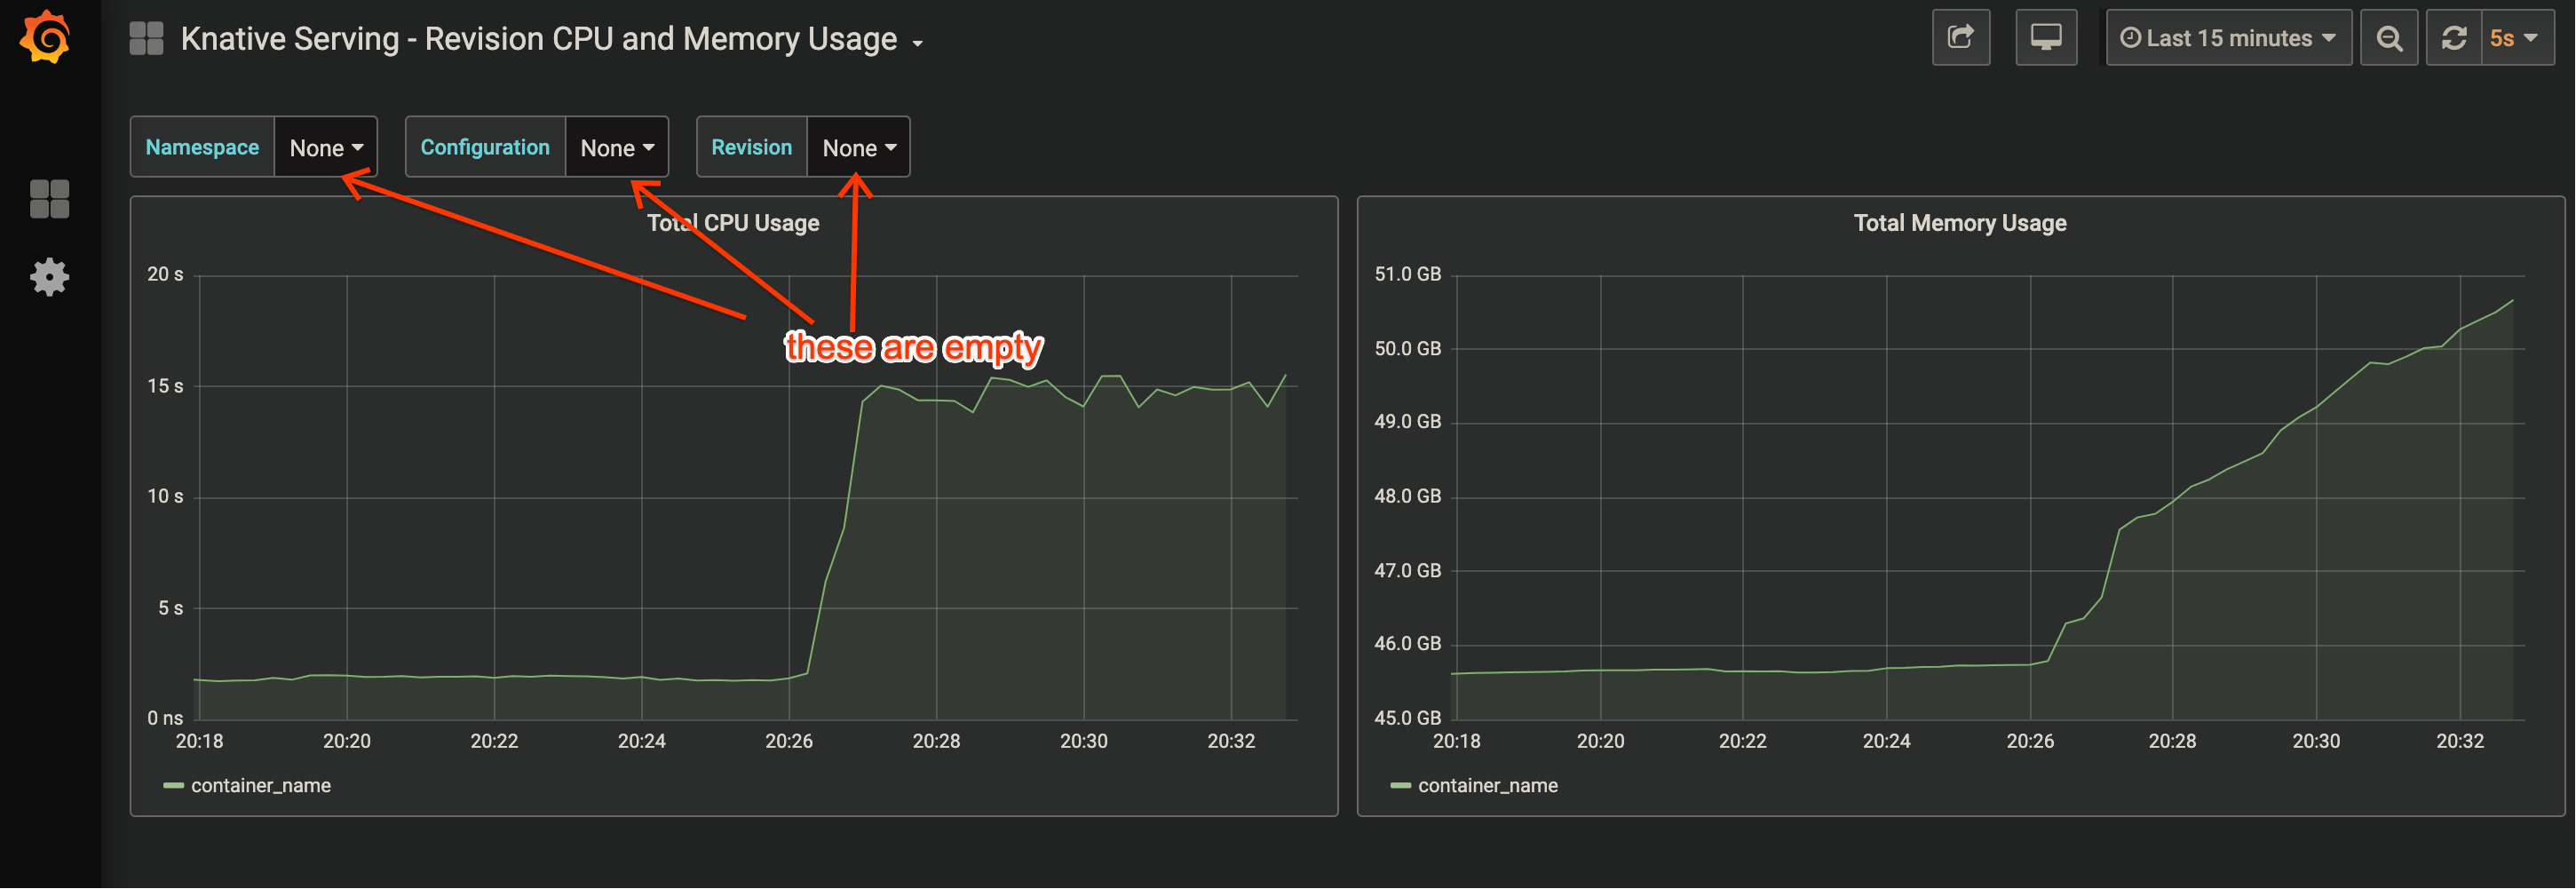
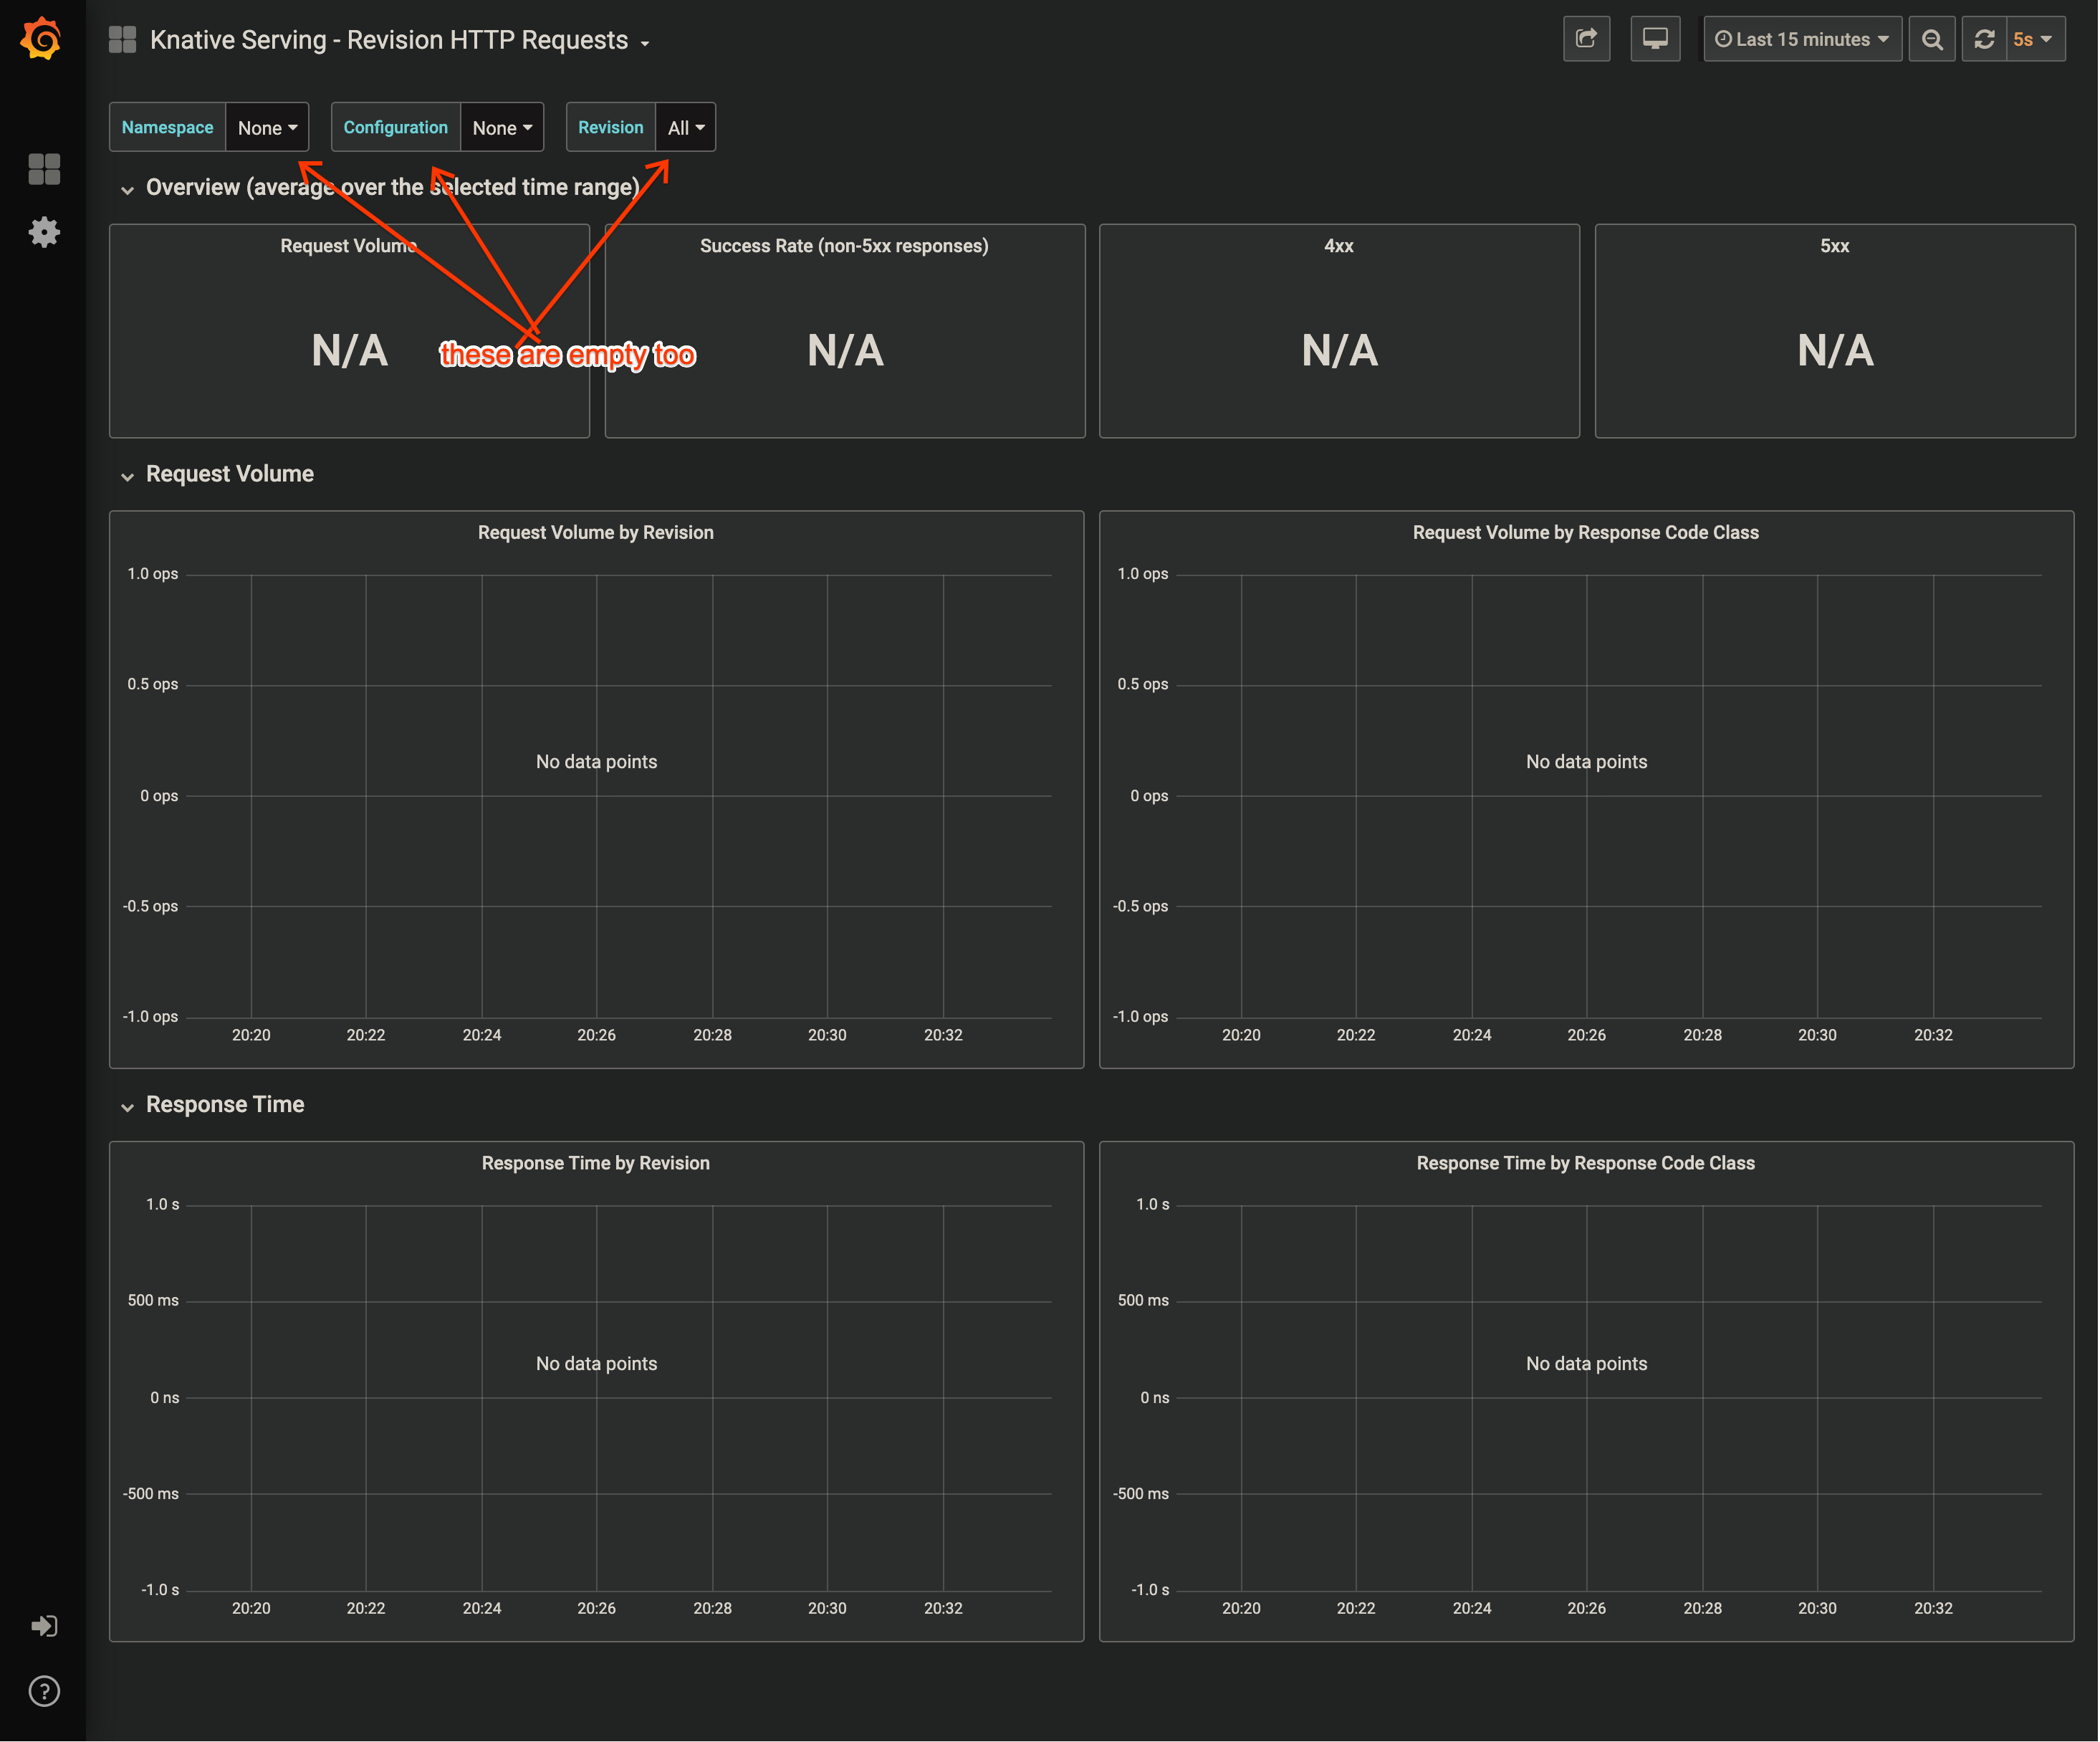
When I look at Grafana dashboards, I see some telemetry about autoscaling metrics but the Revision Request Count metrics are empty. It doesn't even show any namespaces, configurations or revisions to choose from in the dropdowns.
See these pictures below (first one is a working dashboard for autoscaler), the rest doesn't seem to be working.
/area monitoring
/kind bug
Potentially the same as #4167 #4229 #4507.
I just installed Knative serving v0.11.0 with monitoring.yaml. I used
istio-leaninstuctions from here to install Istio from HEAD (near 1.4.2).It seems most of the useful Grafana dashboards are broken.
(If so, please consider taking Grafana out of docs for now. If it's broken for 6 months, no point of documenting it as if it's working.)
When I look at Grafana dashboards, I see some telemetry about autoscaling metrics but the Revision Request Count metrics are empty. It doesn't even show any namespaces, configurations or revisions to choose from in the dropdowns.
See these pictures below (first one is a working dashboard for autoscaler), the rest doesn't seem to be working.