[MRG] ENH: alternative layout of extra points in interpolation #5754
Conversation
|
Personally I don't mind the second one. We have already discussed having a new param |
|
I like |
It makes sense to me to have the edge/"stop interpolating" point be beyond your "average" electrode spacing. It's roughly equivalent to thinking of your data at each electrode representing a value at the center of pixel within grid. In addition to be a simple way of framing things, it has the advantage of not letting you think that you have data outside that range, which becomes especially important after picking channels. Pick a larger spacing, and your difference between the picked and un-picked representations could very well become worse. Speaking of which, somewhere we set a mask for the
I suspect that this will mostly be alleviated somewhat by the
We'll have to see how it does in testing. I'd use the median neighbor-to-neighbor (from the Delaunay triangulation) distance because it's the simplest reasonably representative thing I can think of. |
|
I agree with all your points.
Yes, the 10% is a temporary hack :) I will change the distance to the median neighbour-to-neighbor.
Oh, yes, I am aware of the mask - I was playing with it recently to generate the masked topos I posted in #5315. I can work on that after this PR. |
|
There are some edge cases to cover too: currently CIs fail due to |
|
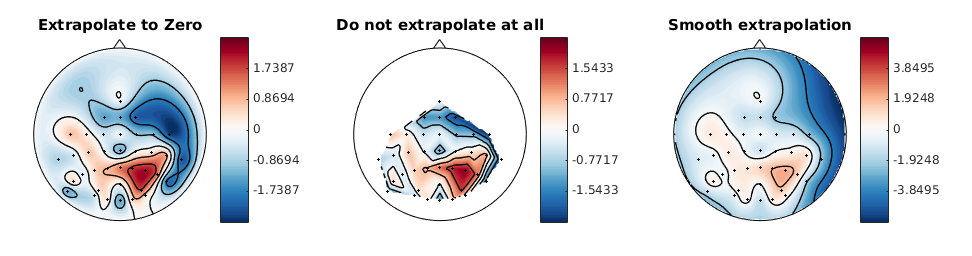
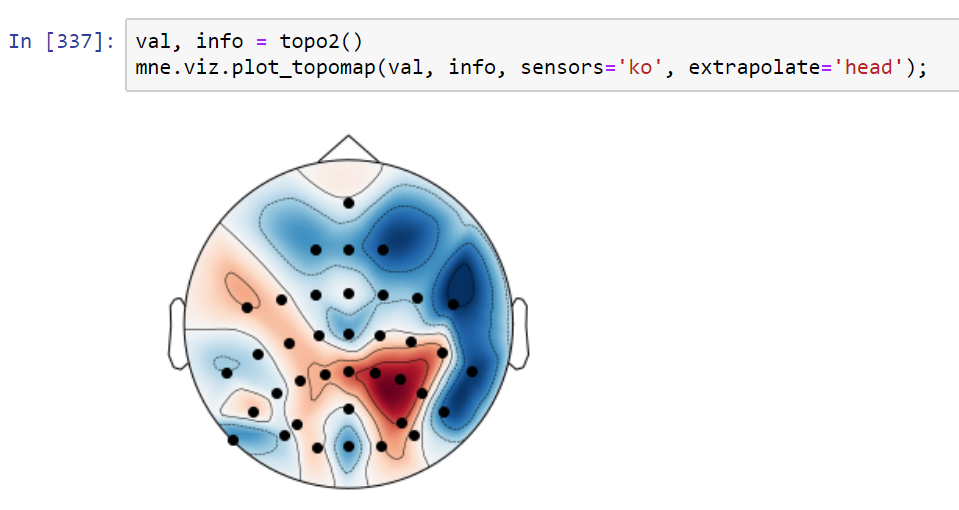
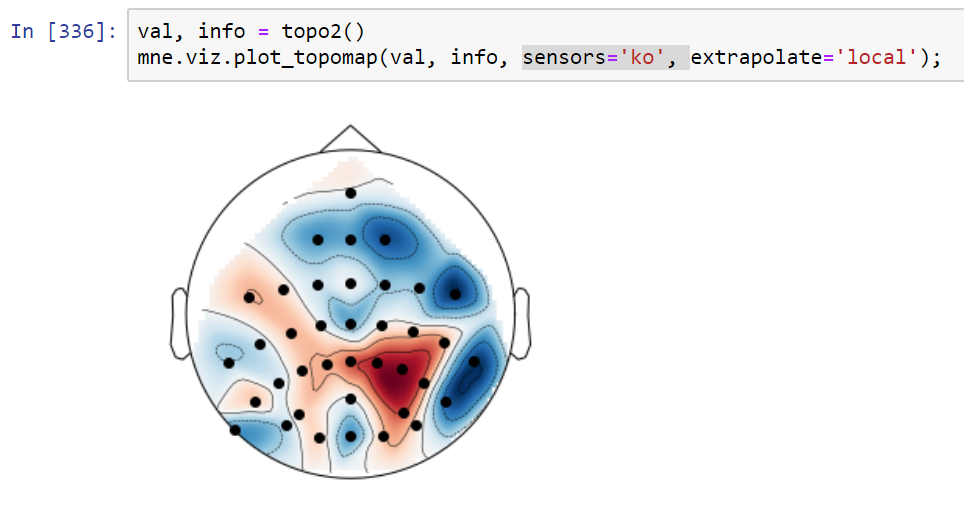
Regarding the added points, I thought they should be exactly on the head circle. Can you try and see how this looks, including setting the values to zero? |
|
@cbrnr - the added values are zero in the "after" example (that's why the colors go to white around these added points). If they were placed on the head circle as it is drawn:
@cbrnr, @jsosulski, @larsoner - If you can paste a few snippets with problematic/interesting topo activity (and channel pos) I could generate more plots for better comparisons. |
|
@mmagnuski but to me it looks like this is what the MATLAB toolbox in #5315 (comment) is doing - the values on the circle are exactly zero, and this looks like it should. |
|
@jsosulski can you share the code snippet you used to produce topoplots with the MATLAB toolbox? |
|
Sure, see this gist. Additionally another example how bbci plots topomaps:
In my opinion, the first one is the best compromise between correctness and aesthetically pleasing. The second one does not look good but is 'most accurate' while the last one seems to be misleading at best.
While true, I must say in the first one the outer values look very close to the strong frontal/central activity which could be misinterpreted as activity in that region. This does not happen in the second case. |
|
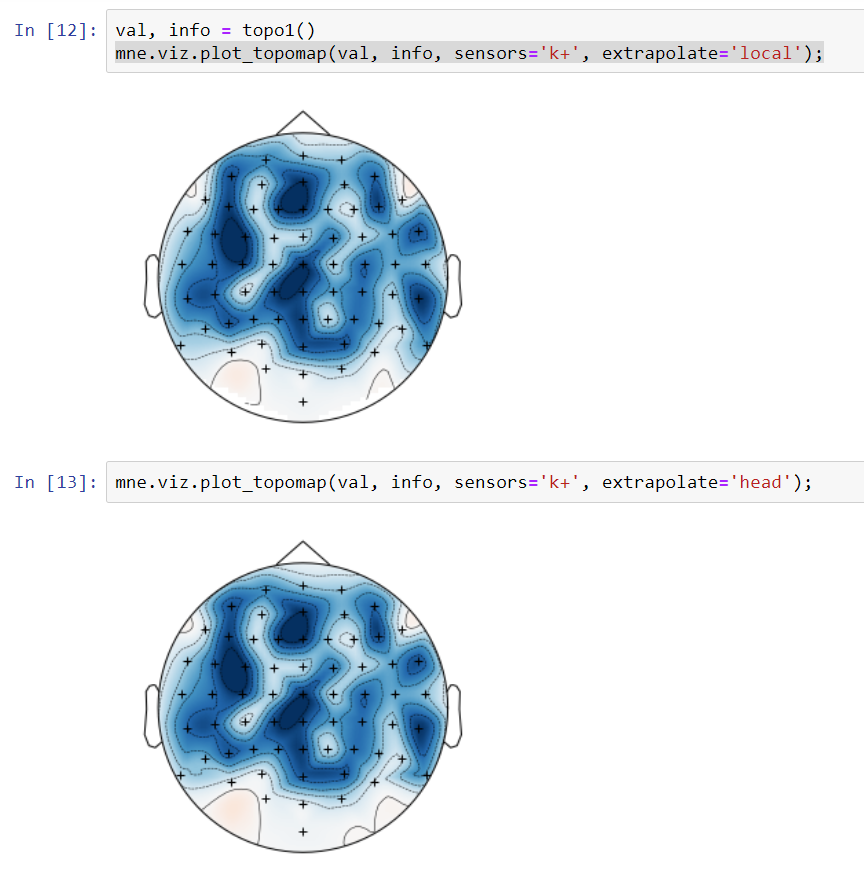
I'll check the placement of extra points on the circle later today (the example below show that it may be useful). But using the circle would have to mean that for skirt we still use something like the convex hull. Currently the data provided by @jsosulski give this with this PR (note that the stretched to fill the whole scalp but that is another problem: #5085): |
|
Thanks for the gist @jsosulski - I think MNE also needs an option to not extrapolate at all. As you say, extrapolating is making up information, so we primarily do this for aesthetic purposes. So maybe there could be a parameter I am also +1 for a Pinocchio parameter 😄. |
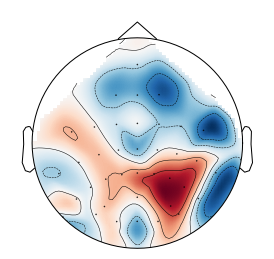
This looks much better than the current default mne topomap!
To compromise, I would use the current method to place these support points, but if they extend beyond the outline of the scalp, put them exactly on the scalp border. This would also (i think) improve the bottom right blue blob in your plot @mmagnuski , which currently does not seem to go towards 0 fast enough. |
That's good. It even shows that the nose is only the peak of a larger pyramid starting at the ears. ;)
Eric suggested
I can check this in a follow-up PR. I'd like to restrict this one to
Yes and we could also add different hairstyles than the default bald. ;) At this point my main questions is: what should be the default for |
Honestly, I don't understand how these parameters influence the plot. Can't we come up with less technical ones (i.e. use similar parameters to the MATLAB toolbox)? Basically, I want to be able to specify if we extrapolate or not. And if we extrapolate, I want to be able to say to which locations we extrapolate, and what the value at these locations is (default zero). I have difficulties understanding what you mean by skirt, local, and (convex) hull, and probably this will also be problematic for other users. |
Sure, these were just my propositions. But to clarify what I meant I respond below:
This would come in the next PR. In this one you could specify how you want to extrapolate (see below).
You could choose whether additional points (the locations to which you want to extrapolate) are placed on the head circle (
That would be
Skirt is an option that is currently available in topo plots, it is designed to match what EEGLAB does (channels below the head circumference are moved outside the head circle). See here for an example: |
|
@larsoner What do you think? And I think we should fall back to the old behavior if there is < 3 channels (this is why CI's fail). |
If by "old behavior" you mean "interpolate to the edges" I don't think that's right, at least for the ConvexHull-style interp. In Convex-hull mode, if there are only co-linear points (i.e., <= 2 points, or > 2 but all along a single line) then we can deal with it by putting a rectangle around them (1x the median distance between points away; if only a single point, then just use some sane, small value like 1/20th or 1/10th of the head diameter; in fact maybe the convex hull should always be the |
|
Thanks @mmagnuski, this makes sense. We should make/update a topoplot tutorial that shows all options once this and the next PR are done. BTW, the argument should be named |
|
@larsoner Yes - I didn't mean exactly what was previously done but some box-like approach. I'll check the max(median, 0.05) too (although I am not sure at which point the channels are scaled to the head circle).
Oh, yes, definitelly!
Yes, I must have meant a cross between |
|
Comparison of |
|
What does my example from #5315 look like? |
|
@cbrnr: Both |
|
@larsoner
|
|
Both variants are much better than the previous default, because the red (positive) patches are much less pronounced. However, the BBCI toolbox topoplot still looks better because it doesn't contain any positive values. |
|
@cbrnr - we can check different interpolation methods later to see if that helps. I could also add more points on the border an we can see if that helps. |
|
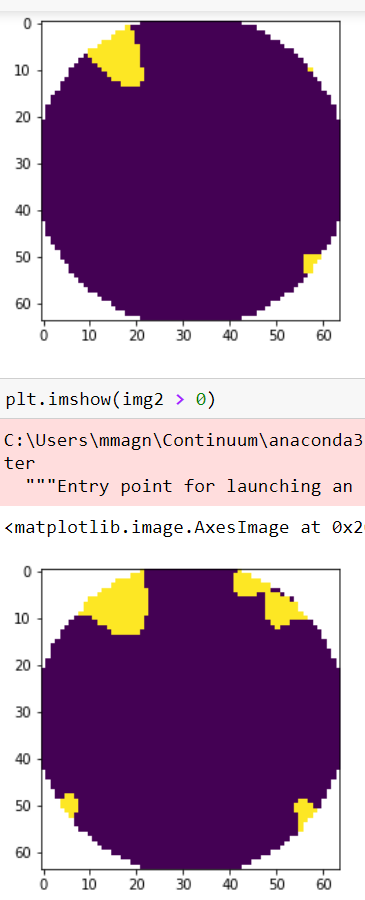
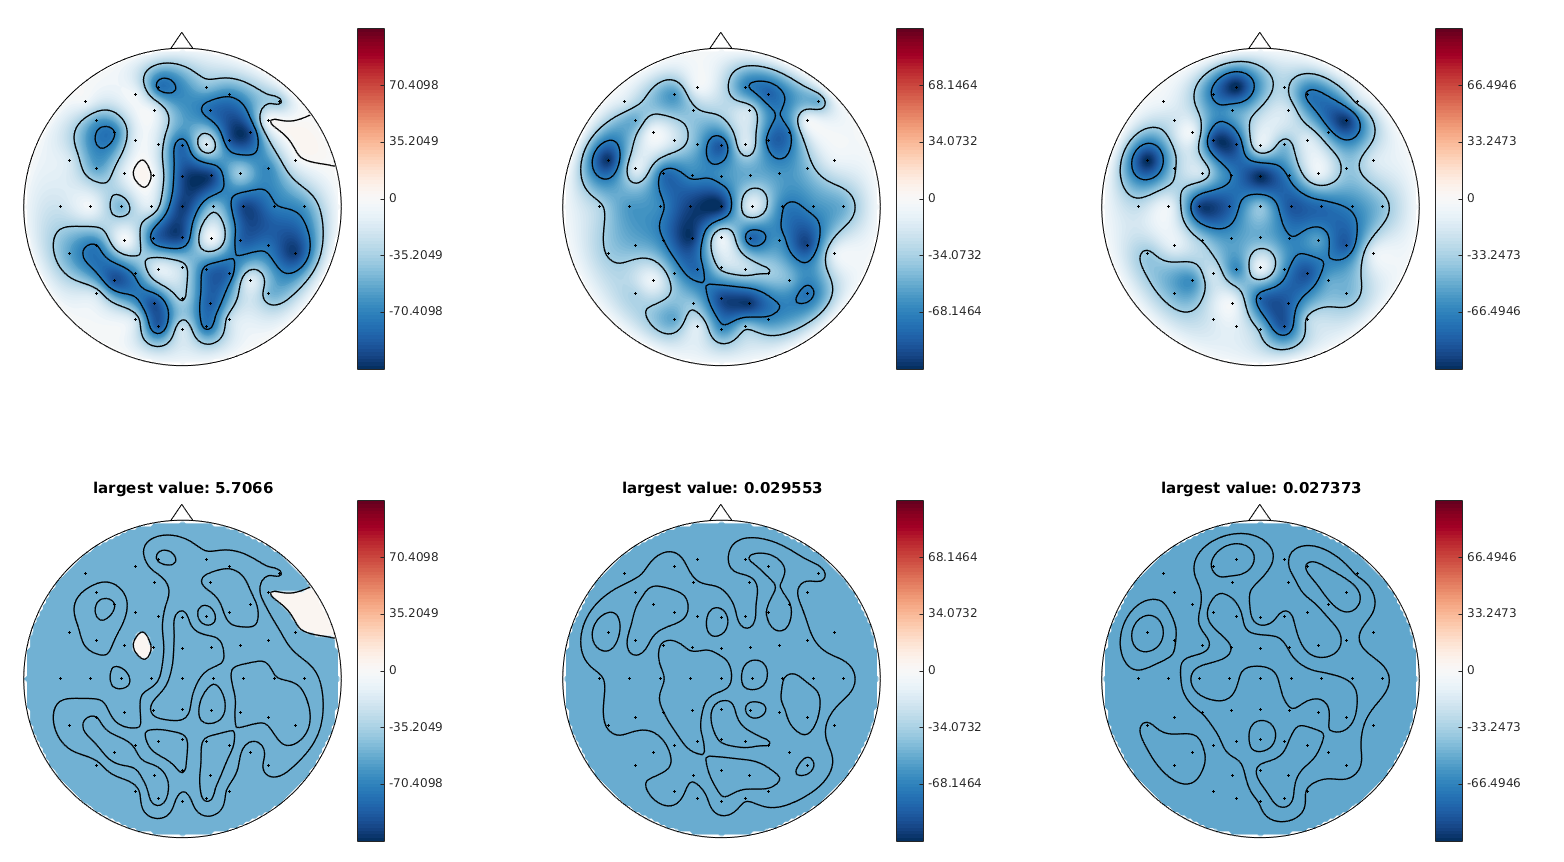
@cbrnr Additional points do not help much. Below you can find images of mask highlighting positive values with more (upper plot) and less (lower) extra points. The figures are without Adding even ludicrous amount of extra points (20 times more than default) doesn't help so much (the plot below is with I'd blame it on different interpolator used and maybe some differences in the 2d layout of channels between mne and the BCI toolbox (it seems that 2d channel positions are different - if one could extract the 2d coordinates of the points we could check that). |
|
I suspect its the different interpolation scheme. @jsosulski can you check if there are any positive values in the BBCI topoplot of my example (e.g. with a mask)? |
|
There actually are, I plotted some random integers between 0 and -100 as I did not have your original data available anymore right now. The plots above show the actual data and below is the mask, where white areas show positive values. The largest (interpolated) value measured is shown in the title.
If one uses linear interpolation, there are obviously no more positive values, but the topomap looks more like a picasso picture. For the above plots the matlab toolbox uses griddata with 'v4' interpolation, i.e. bi-harmonic spline interpolation. |
121fac9 to
bc80374
Compare
|
Thanks for the comments @cbrnr, I think I adressed all. Now I am at the mercy of CIs... |
|
There are still some open comments about magic numbers and a missing "the" in two or more places. Since the CIs have already failed you might as well push these changes. |
|
Travis CircleCI |
|
@cbrnr, thanks, I'll fix it later today. |
|
thanks @larsoner I'm on it. |
|
Thanks @mmagnuski! |
|
Unbelivable - it's finally merged :) |
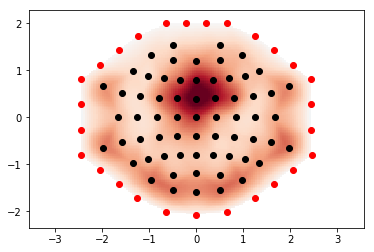
Implements the extra points layout for topo interpolation discussed in #5315
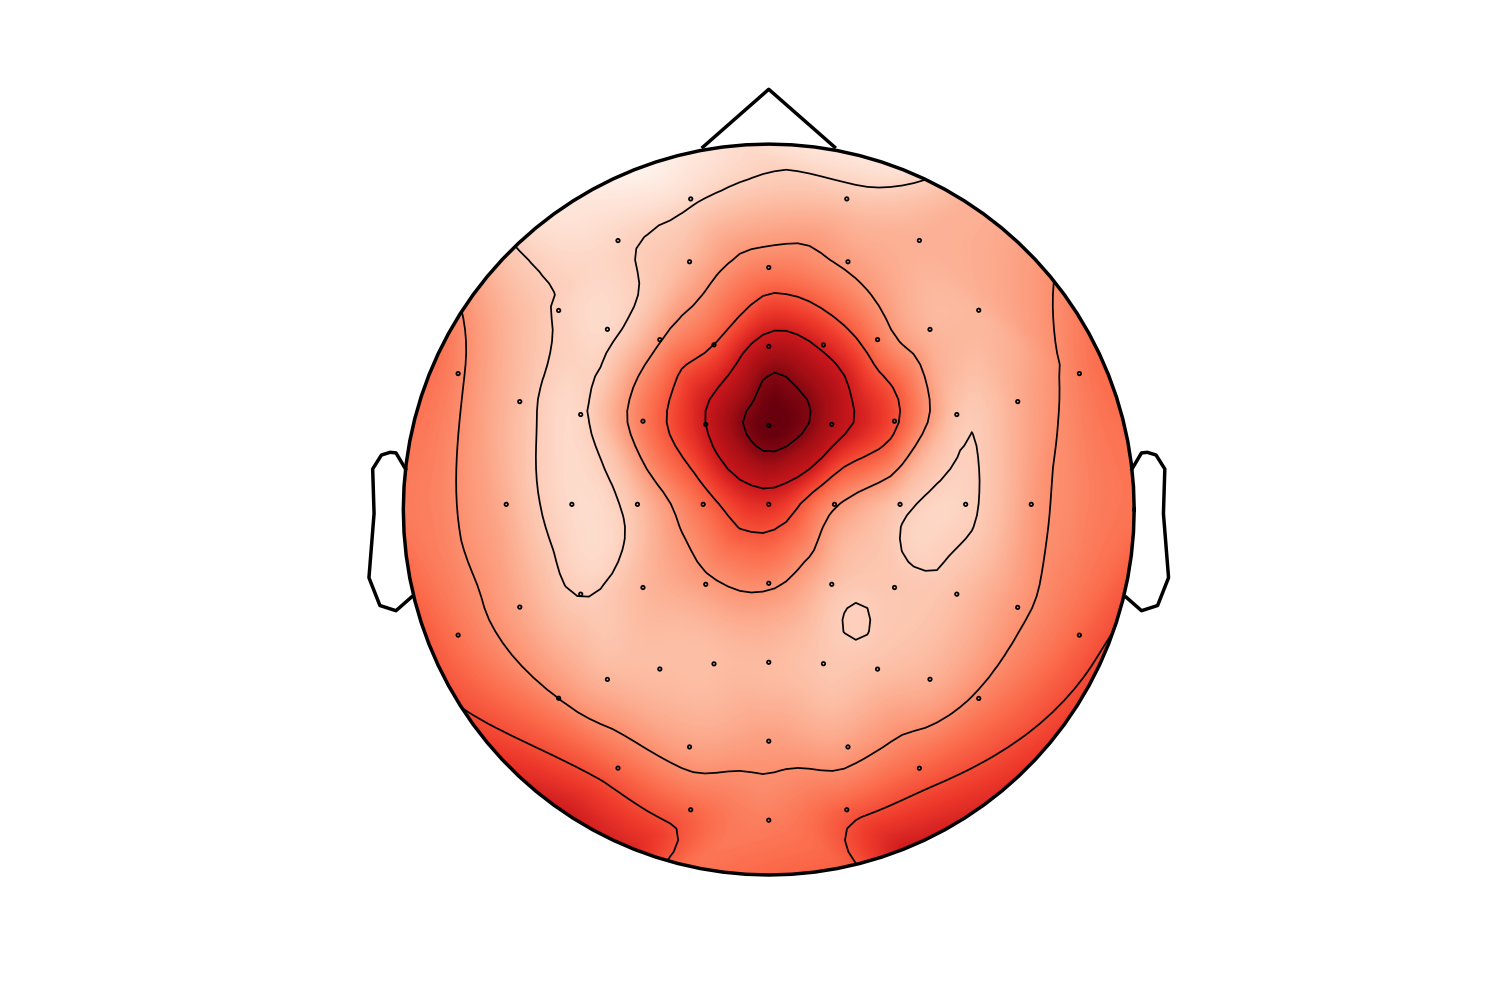
It may eliminate the issues raised in #5315 but it might be suboptimal in some standard cases. For example this is a frontal theta topography before this PR:
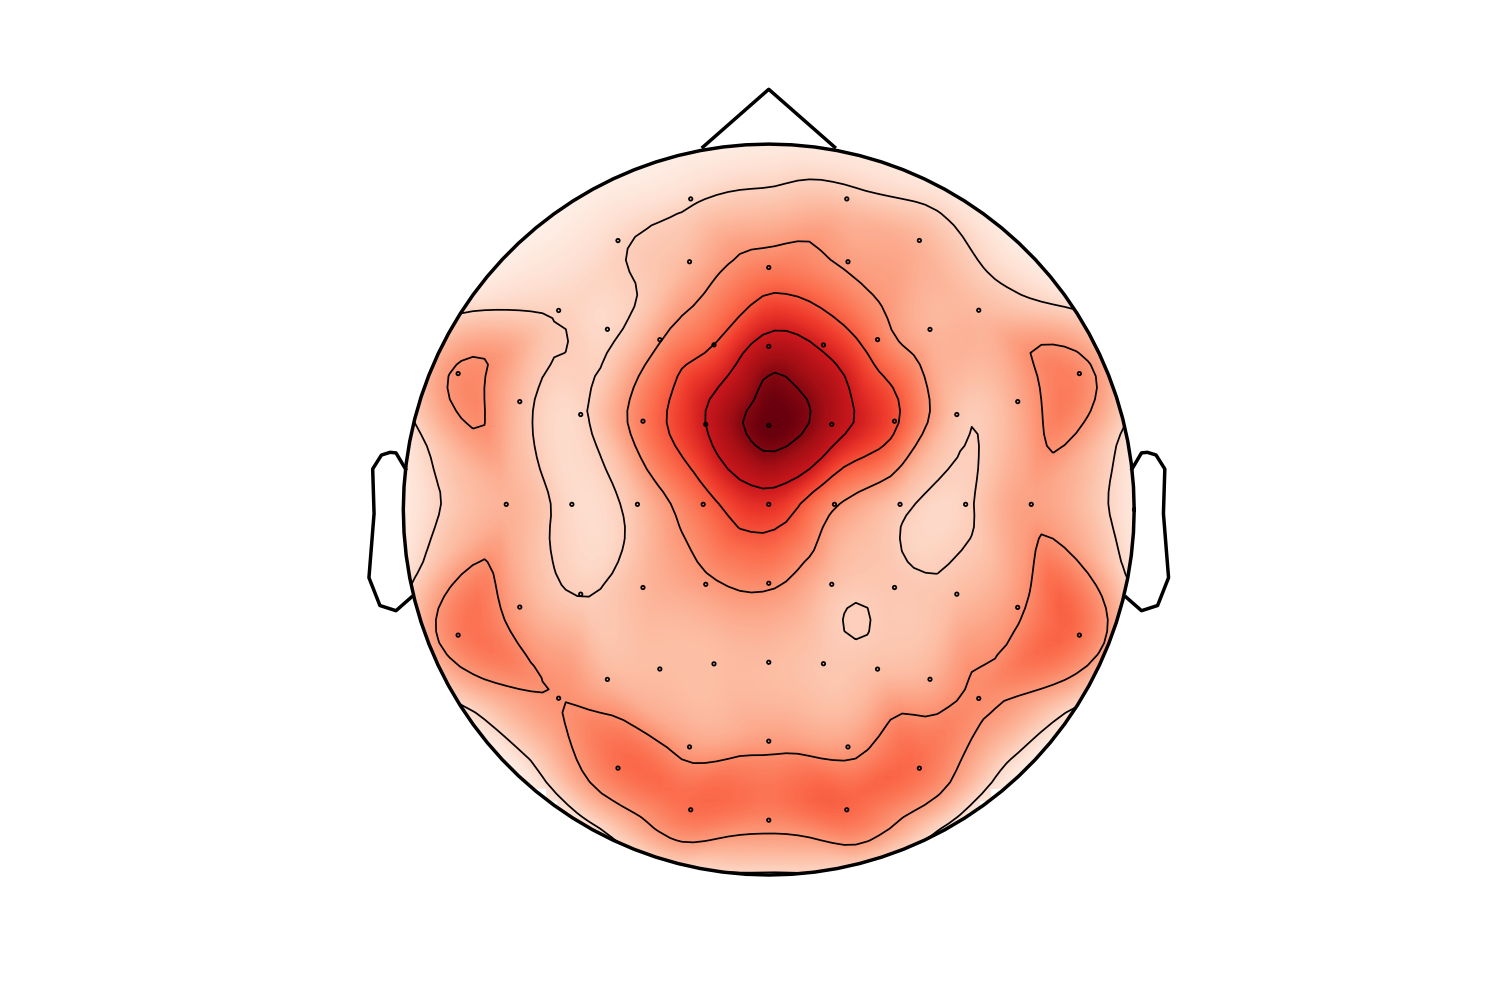
and this is after:
I must say I prefer the "before" topo in this case (the "after" looks like a laughing cyclops in a party hat). Probably the extra points are too close to channels. I'll check that later. Also - masking using convex hull (but slightly less extended than here) might make it better.
TODO:
'box'bacause the additional points were added on a rectangular box)outlines='skirt'extrapolate='local'