MRG: Enable point picking in _TimeViewer #7247
Conversation
Codecov Report
@@            Coverage Diff             @@
##           master    #7247      +/-   ##
==========================================
+ Coverage   89.93%   89.96%   +0.02%
==========================================
  Files         451      451
  Lines       81795    81846      +51
  Branches    12977    12982       +5
==========================================
+ Hits        73564    73630      +66
+ Misses       5404     5385      -19
- Partials 2827 2831 +4 |
|
The shortcut is |
|
Mostly throwing out ideas here -- the most relevant VTK examples I could find are:
We could put a time course up right over the 3D scene if you want (charts on 3D scene). But it might be cleaner to have the drawing area be split somehow, e.g. upper 2/3 for 3D lower 1/3 for 2D chart (if and only if
This would allow comparing multiple time courses very easily, which is nice. The dots that appear on the surface (probably from a scatter 3D sort of thing) could have the center colored according to the color that is used in the chart. This would be a killer interactive data browsing feature for me personally... (Someday, in the distant future, maybe we could also show time-frequency data by displaying a rectilinear grid on axes. But the time-course is much more important.) |
Wow, really nice UX. I will pin that in the issue as a todo list. |
|
Thank you so much @alexis-cvetkov for the help, the UX has been improved drastically! |
|
Thanks for the feedback @drammock, I'll make a pass to rename those |
|
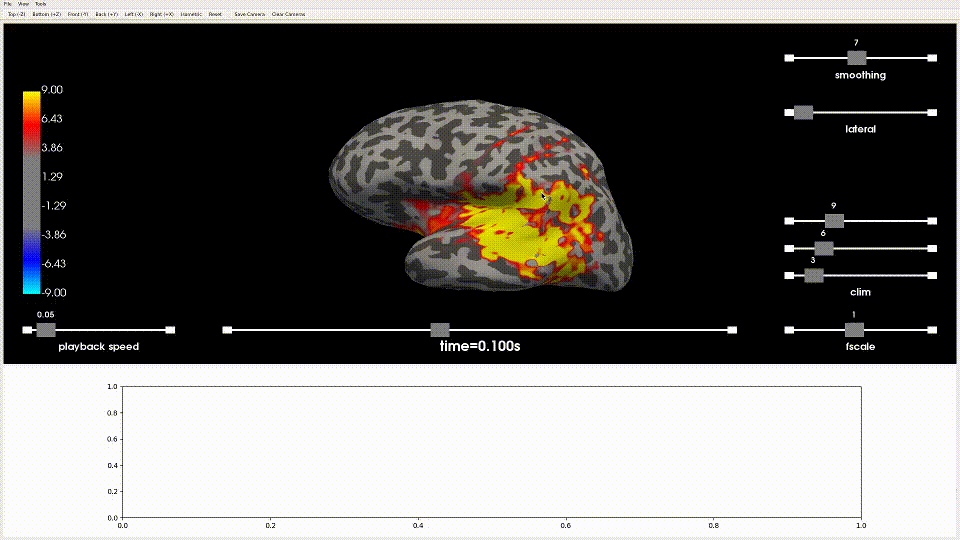
This is the latest result:
|
|
Awesome! Happy to try and push some As far as picking goes I would say leave enable it by default if they have |
|
Feel free to modify as you wish. I have a question about |
|
|
|
BTW @GuillaumeFavelier like the volume viewer I think if |
|
I'll take care of it 👍 |
|
Okay I'll test and push some |
|
The interaction is weird/not what I expected. Pressing "p" is when it picks a point. I think it should pick whenever you click. And clicking on the sphere that appears should make the point disappear. |
|
(Also a MPL figure window opens in addition to there being an embedded one, I'll try to fix this) |
Sorry, maybe I didn't understand correctly. Get rid of what exactly? It shouldn't even be possible to use In general, I agree with you that we should focus on what's necessary 👍 |
|
Linear temporal interpolation by default? It's what brain.save_movie will
do in PySurfer. (Actually it uses quadratic interpolation, but this is
probably overkill.) It makes viewing data smoother. But it's easy enough to
use nearest instead by default if it's really problematic for people
Sorry for being slow here but why not indexing with integers the time axis
and display the corresponding time in s or ms. I thought it was was we were
doing. When I move along time axis I expect to move according to the
sampling rate of the data.
my 2c
|
|
I agree with @agramfort - using the interface (dragging the time slider) I would expect to travel through time samples without any interpolation. However I understand it is important for movie playback. Is the movie playback bad without this time interpolation? |
ummm ... I was getting a large text at the top of the scene saying I could use P or R. I think it appeared after I selected an option from the menu. Happy to take a look again once the PR is closer to being merged. |
|
Okay let's make nearest the default @GuillaumeFavelier . At some point we can make the interpolation mode easily publicly settable. But I would suggest that people try the spacebar playback with linear mode and nearest mode so that you can fully judge the situation. People have seemed pleased about "smoothness" and if such comments had to do with the playback, nearest interpolation mode will be less smooth. |
|
... which you can do by setting |
I think the main difference between the trace of a signal produced via |
It's noted on #7162 , I'll work on
I understand better now: the option for cell picking in the menu is not compatible with what we have when |
|
@GuillaumeFavelier I pushed a commit to more fully and cleanly parametrize one of the tests, and in adding |
|
I encountered this one locally too, I will fix in this PR |
|
Thanks @GuillaumeFavelier !!! |
* Enable basic point picking

* Pick & plot time course

* Use only one action to pick & plot

* Improve UX drastically

* Rename polydata to avoid confusion with pandas

* Fix unpacking of mesh data

* Change string formatting

* Use MPL_canvas

* Improve docstring

* FIX: mpl tweaks

* Add show_traces parameter to plot_source_estimates

* Increase the glyph radius to 10

* Update the 3d backend overview table

* Refactor pick_point()

* Initialize the defautl point

* Update picking experience

* Use cell picking

* Modify default size for glyph

* Update legend

* ENH: Add auto mode by default

* FIX: Fix to logic

* FIX: Flake

* Refactor color cycle

* Enable interactive widgets in test_3d.py

* Update the tests

* TST: Put time_viewer=False and show_traces=False by default

* Refactor PyQt5 import

* Use composition for MplCanvas

* Revert "Refactor color cycle"

This reverts commit a76a0ae.

* Disable interactivity in plot_sparse_source_estimates

* Add support for hemi=both

* Add support for hemi=split

* Push hotfix for both/split

* Display MNI coordinates

* Add support for show_traces=separate

* FIX: Legend

* Add support for views

* ENH: Add idx=

* Refactor time_viewer testing

* Add tests for traces

* Improve testing

* FIX: Parametrize

* Fix view indexing logic

* Test remove_point

* Add TstVTKPicker

* Fix style

Co-authored-by: Eric Larson <larson.eric.d@gmail.com>
This PR enables point picking and display the vertex id as text in the top left. It's the first step to achieve #7235. Shortcut is
pto pick under the mouse. This is still a work in progress.Animation
ToDo
#7235 (comment)
Closes #7235
It's an item of #7162