added monitoring tab with metrics section #3961
Conversation
|
/kind feature |
|
/assign @vikram-raj @invincibleJai |
|
/retest |
frontend/packages/dev-console/src/components/monitoring/overview/MonitoringMetricsSection.tsx
Outdated
Show resolved
Hide resolved
frontend/packages/dev-console/src/components/monitoring/overview/MonitoringTab.tsx
Outdated
Show resolved
Hide resolved
frontend/packages/dev-console/src/components/monitoring/overview/MonitoringTab.tsx
Outdated
Show resolved
Hide resolved
frontend/packages/dev-console/src/components/monitoring/overview/MonitoringMetricsSection.tsx
Outdated
Show resolved
Hide resolved
2331822 to
6e823ff
Compare
|
/retest |
There was a problem hiding this comment.
I think the Gird layout is not needed here. Because anyway we are displaying a single graph in a row.
frontend/packages/dev-console/src/components/monitoring/overview/MonitoringMetricsSection.tsx
Outdated
Show resolved
Hide resolved
There was a problem hiding this comment.
one component per file please
frontend/packages/dev-console/src/components/monitoring/overview/MonitoringMetricsSection.tsx
Outdated
Show resolved
Hide resolved
frontend/packages/dev-console/src/components/monitoring/overview/MonitoringSection.scss
Outdated
Show resolved
Hide resolved
frontend/packages/dev-console/src/components/monitoring/overview/MonitoringTab.tsx
Outdated
Show resolved
Hide resolved
There was a problem hiding this comment.
/cc @openshift/openshift-team-monitoring
There was a problem hiding this comment.
these seem pretty duplicate to the grafana dashboards we're embedding into the console, do we really want multiple pages that show the same data?
There was a problem hiding this comment.
/cc @openshift/openshift-team-monitoring
frontend/packages/dev-console/src/components/monitoring/overview/MonitoringMetricsSection.tsx
Outdated
Show resolved
Hide resolved
frontend/packages/dev-console/src/components/monitoring/overview/MonitoringMetricsSection.tsx
Outdated
Show resolved
Hide resolved
frontend/packages/dev-console/src/components/monitoring/overview/MonitoringMetricsSection.tsx
Outdated
Show resolved
Hide resolved
frontend/packages/dev-console/src/components/monitoring/overview/MonitoringTab.tsx
Outdated
Show resolved
Hide resolved
There was a problem hiding this comment.
Why a grid ? Seems like it's just stacking on top of each other. Also don't wrap single elements in a fragment.
frontend/packages/dev-console/src/components/monitoring/overview/MonitoringTab.tsx
Outdated
Show resolved
Hide resolved
frontend/packages/dev-console/src/components/monitoring/overview/MonitoringMetricsSection.tsx
Outdated
Show resolved
Hide resolved
|
How often are we getting events that is causing the entire topology to rerender? |
|
/approve |
|
@christianvogt @abhi-kn have added below issues to track based on comments and showing just three visualization |
updates extension support for sidebar
|
[APPROVALNOTIFIER] This PR is APPROVED This pull-request has been approved by: abhi-kn, christianvogt, vikram-raj The full list of commands accepted by this bot can be found here. The pull request process is described here DetailsNeeds approval from an approver in each of these files:
Approvers can indicate their approval by writing |
|
/test analyze |
|
/retest Please review the full test history for this PR and help us cut down flakes. |
Fixes:
https://issues.redhat.com/browse/ODC-2586
Analysis:
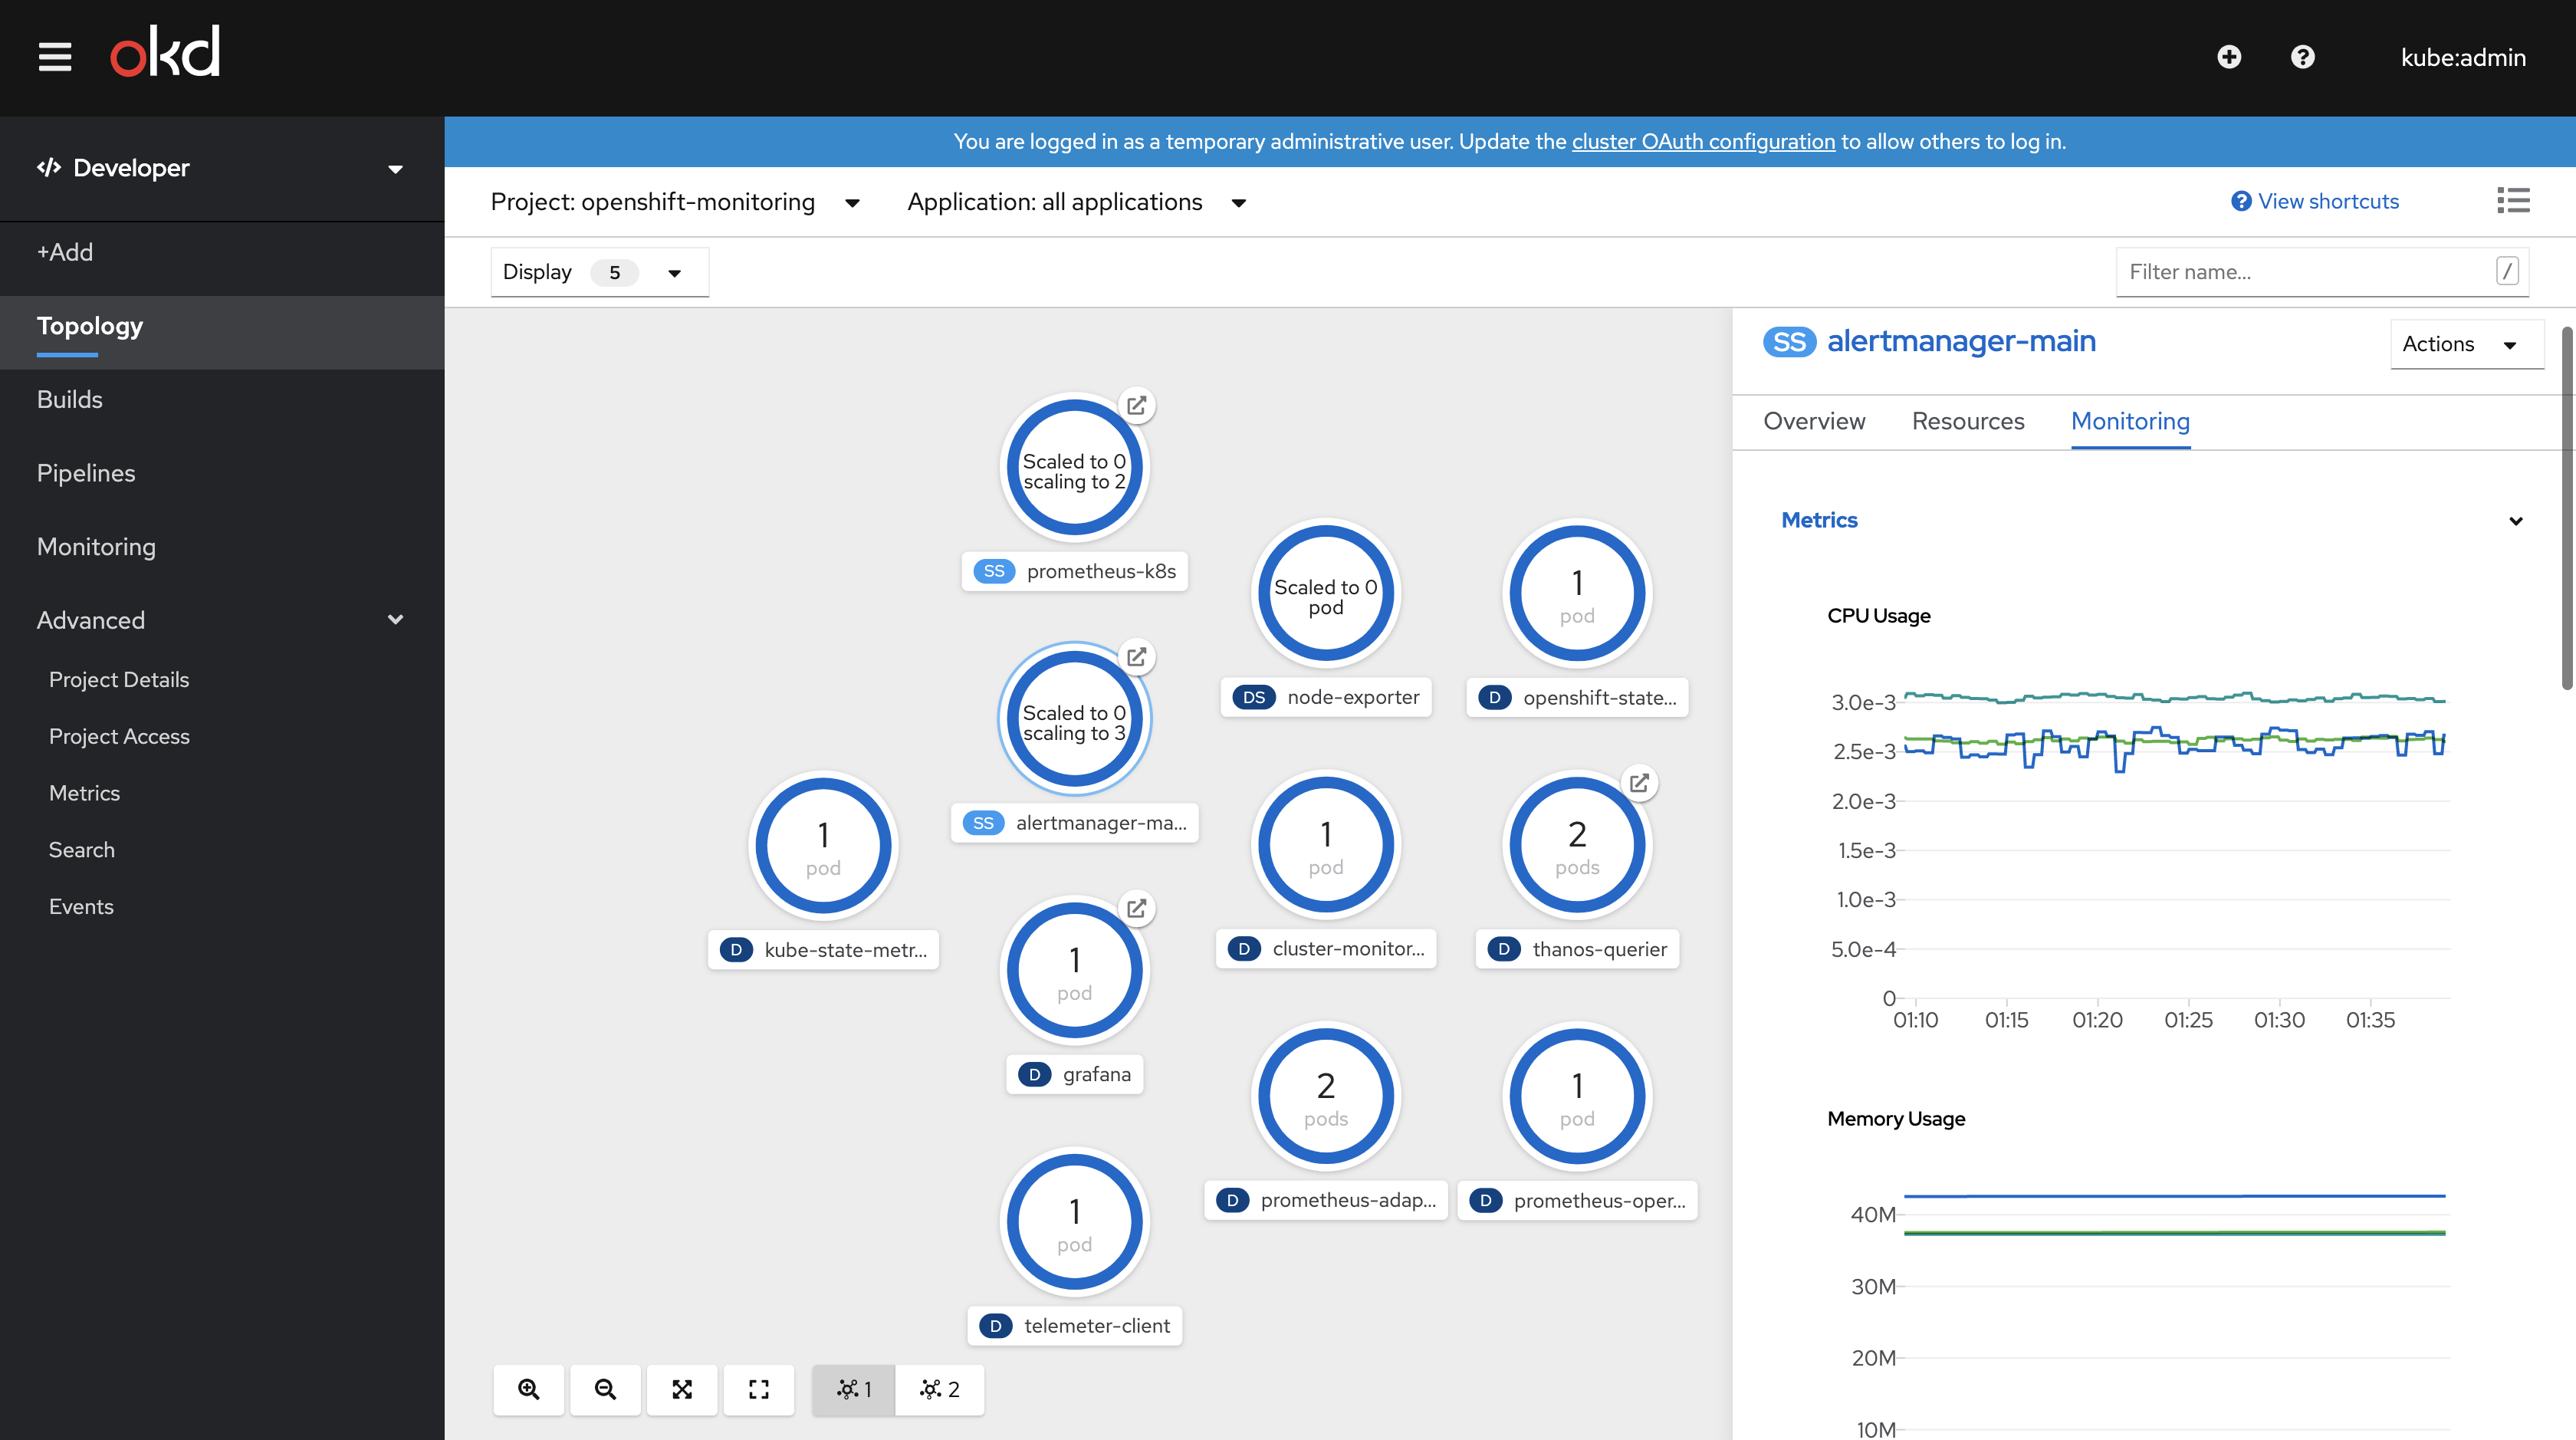
This US requires a monitoring tab to be displayed in topology side panel when a workload type resource is selected. Workload types supported in this PR are Deployment, DaemonSet & StatefulSet. Other type of workloads yet to be analysed w.r.t Prometheus support.
Solution Description:
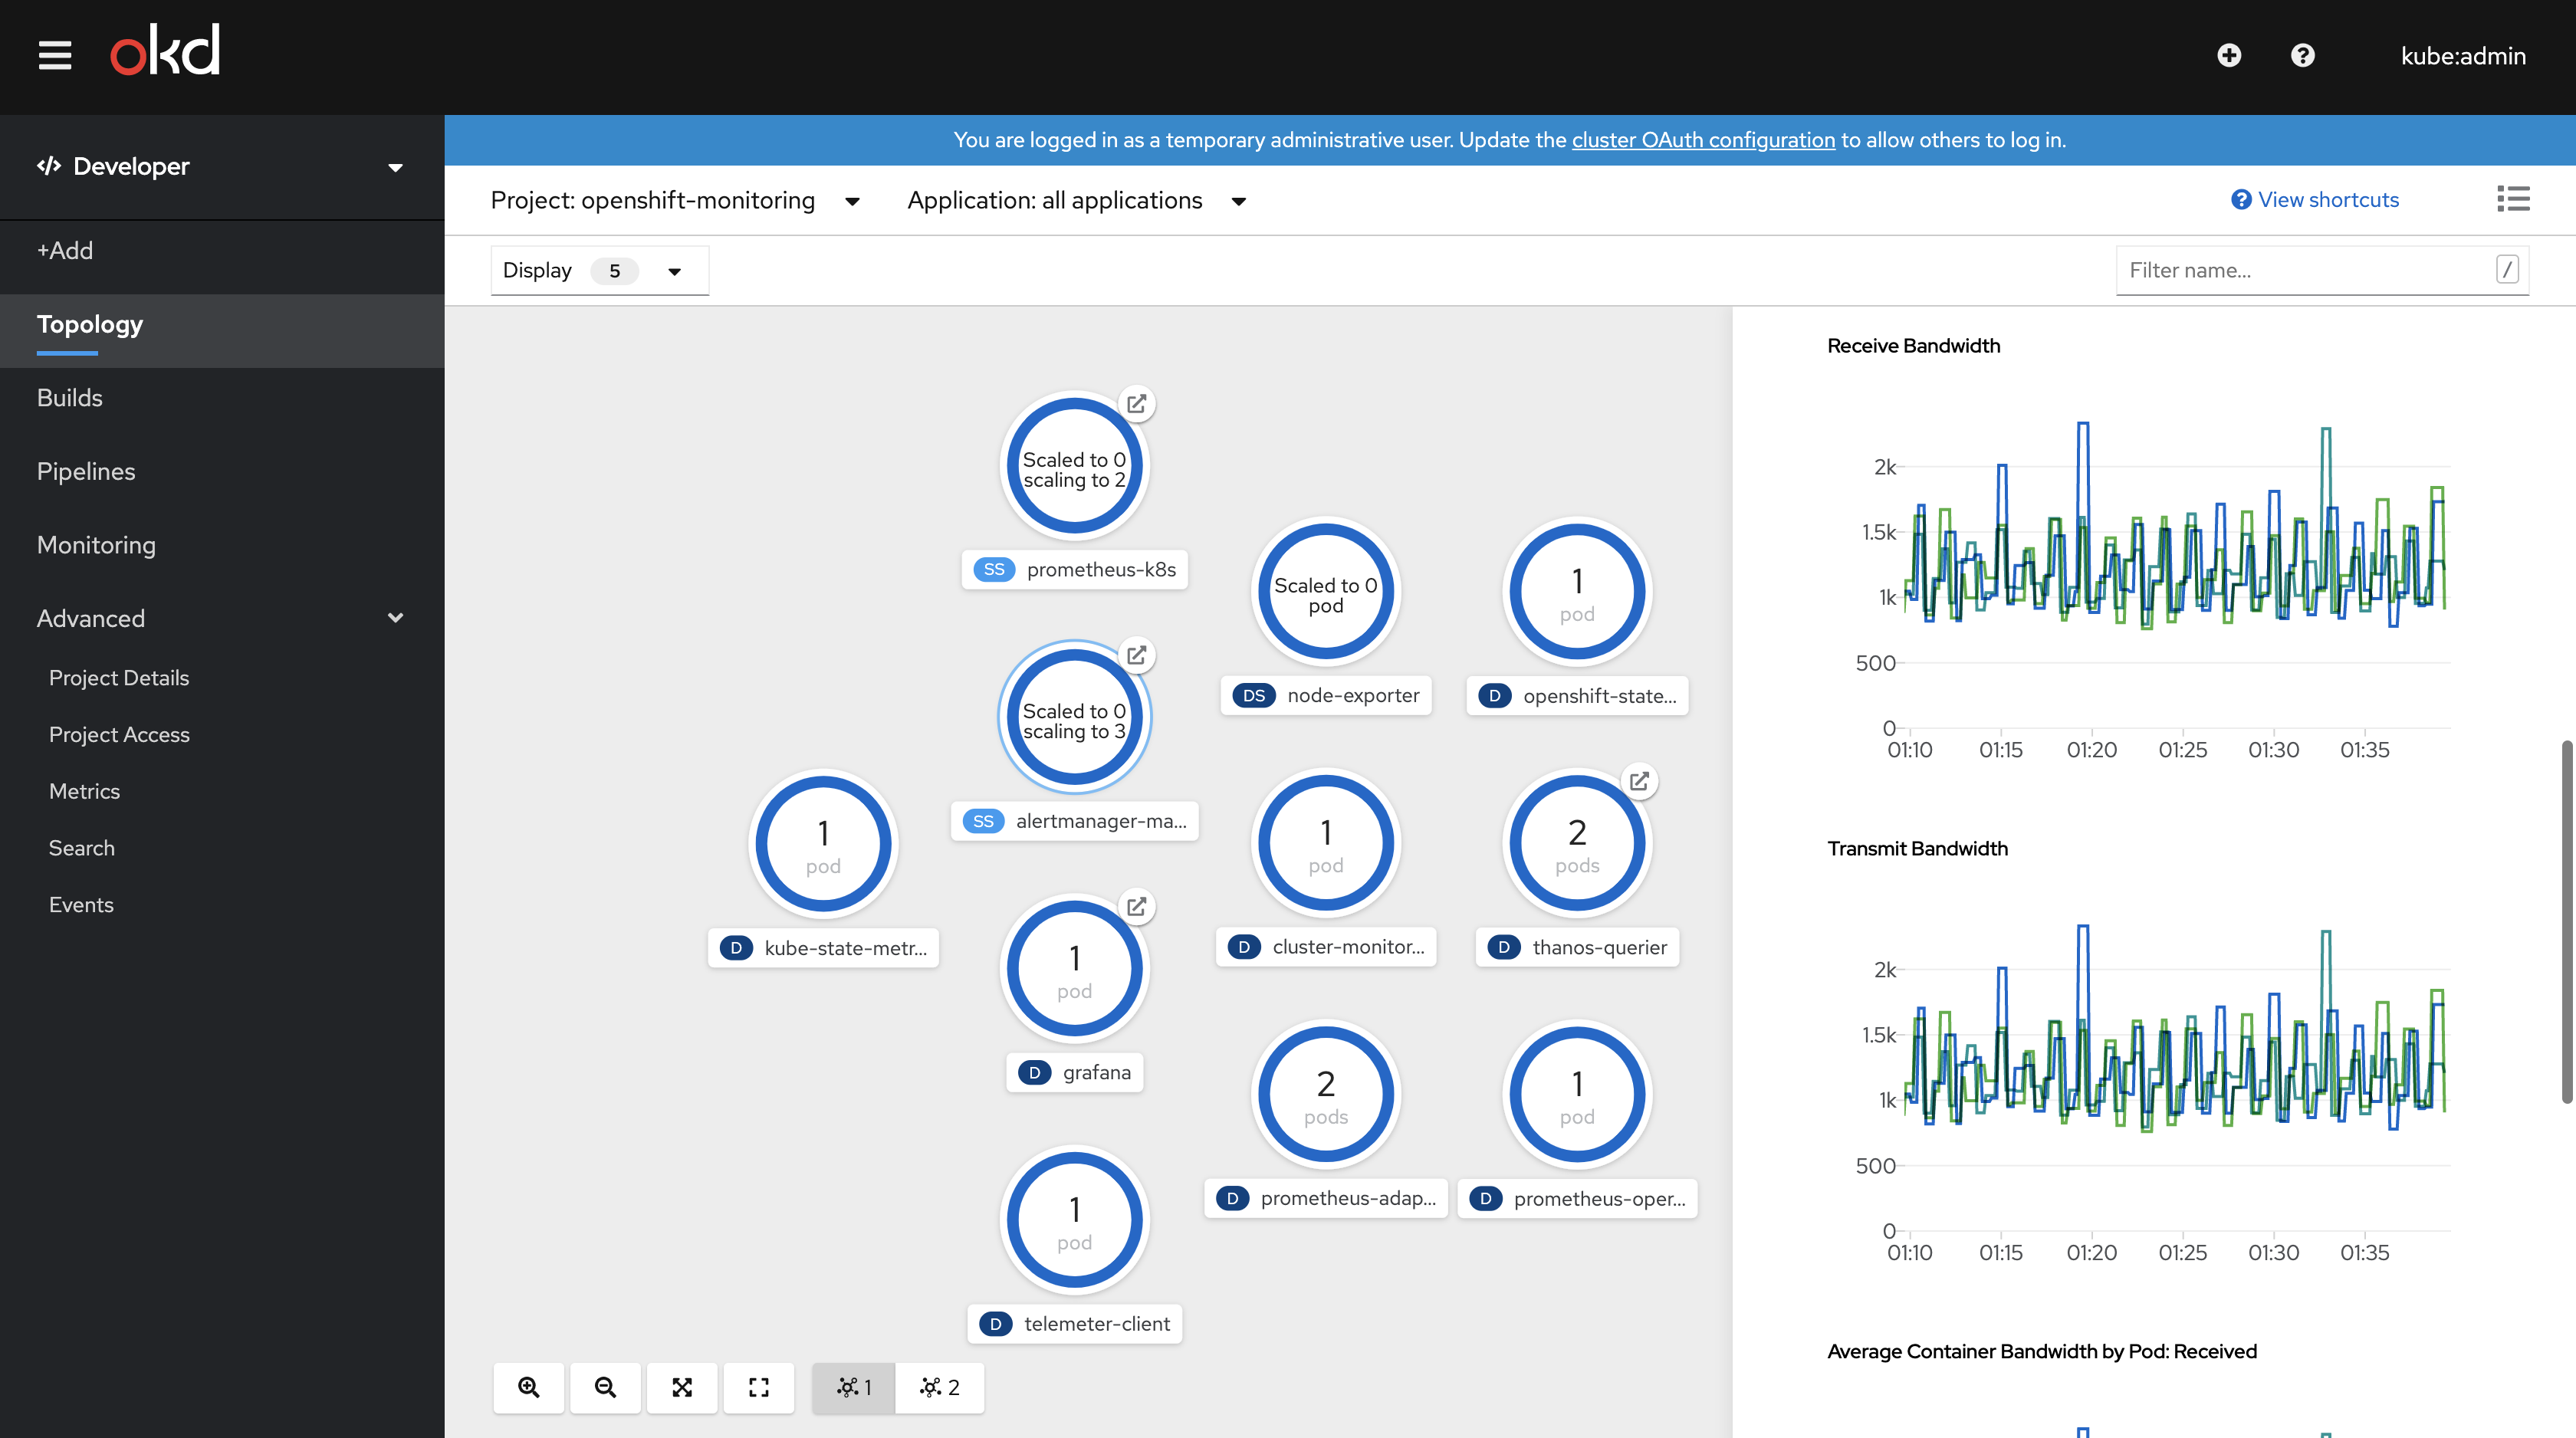
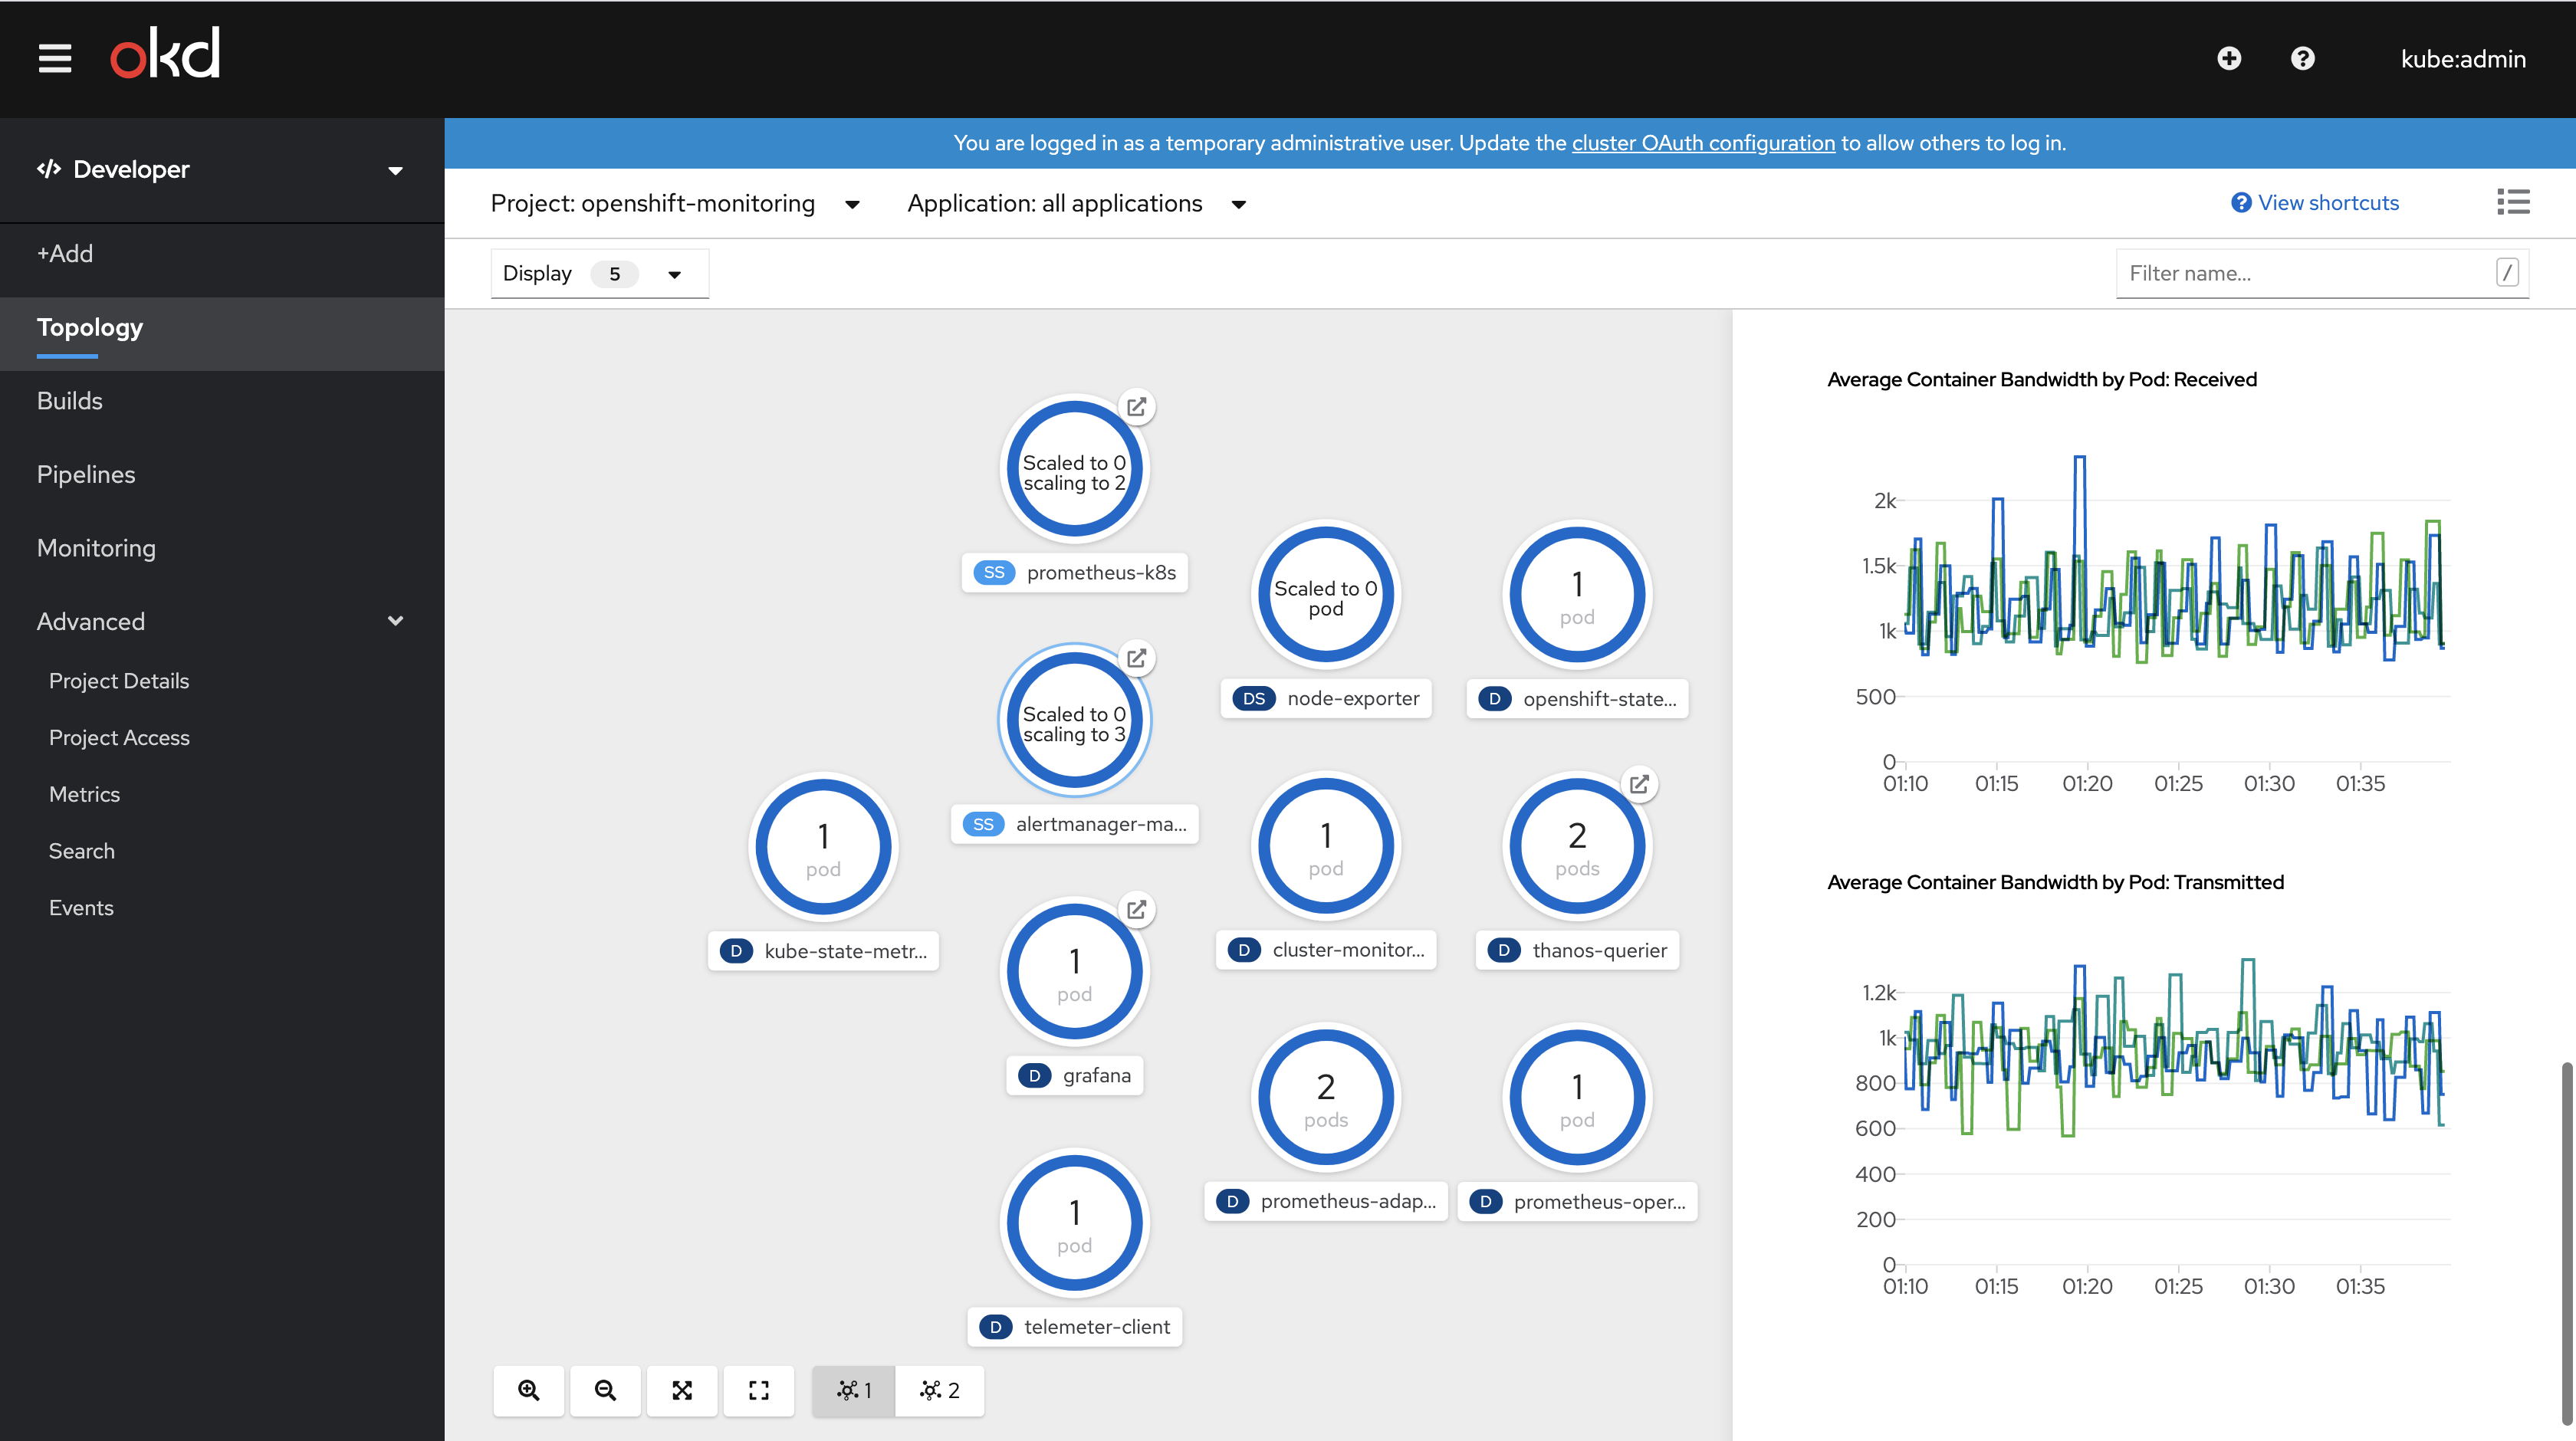
Monitoring tab has been implemented in dev console & exposed through dev console plugin. Metrics section reuses MonitoringDashboardGraph component from /monitoring/dashboard to display graphs/plots. Prometheus queries used are yet to be reviewed by @christianvogt & Steve. Proposal doc for queries.
Note: post 4.4 feature freeze we would look into leveraging dashboard work done in console
Screen shots / Gifs for design review:
@openshift/team-devconsole-ux
Unit test coverage report:

Browser conformance: