What is PEGR?
Platform for Epigenomic and Genomic Research (PEGR) is a web service platform that logs metadata for samples and sequencing experiment, manages the data processing workflows, and provides reporting and visualization. PEGR links together people, samples, protocols, sequencer and bioinformatics computation. The development home of PEGR is at https://github.com/seqcode/pegr, where you can find a quick-start guide and more information at wiki.
There are three user groups:
- Admin: admins have almost all the authorizations (read and write access) except for the access to personal password and API keys.
- Member: members have read access to all the projects, inventory, lab protocols, experiment records, sequencing run reports and samples. They will have additional write access based on their project roles and their ownership to specific inventory, protocols and experiment records.
- Guest: guests are only able to see their personal information and the projects they have been assigned to (see Project Roles).
PEGR provides a "Project" interface that organizes samples by scientific projects.
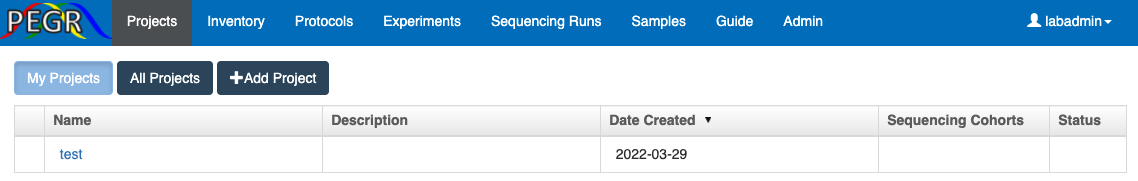
Users can create their own projects by clicking the "+Add Project" button.
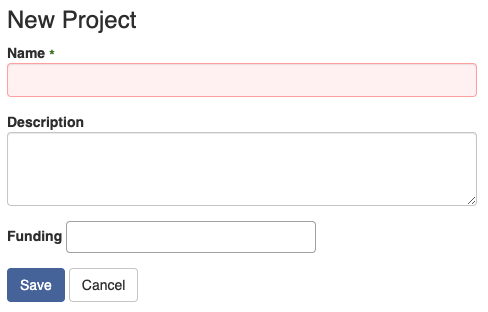
Once they create a new project, they will see the dashboard of the newly created project.
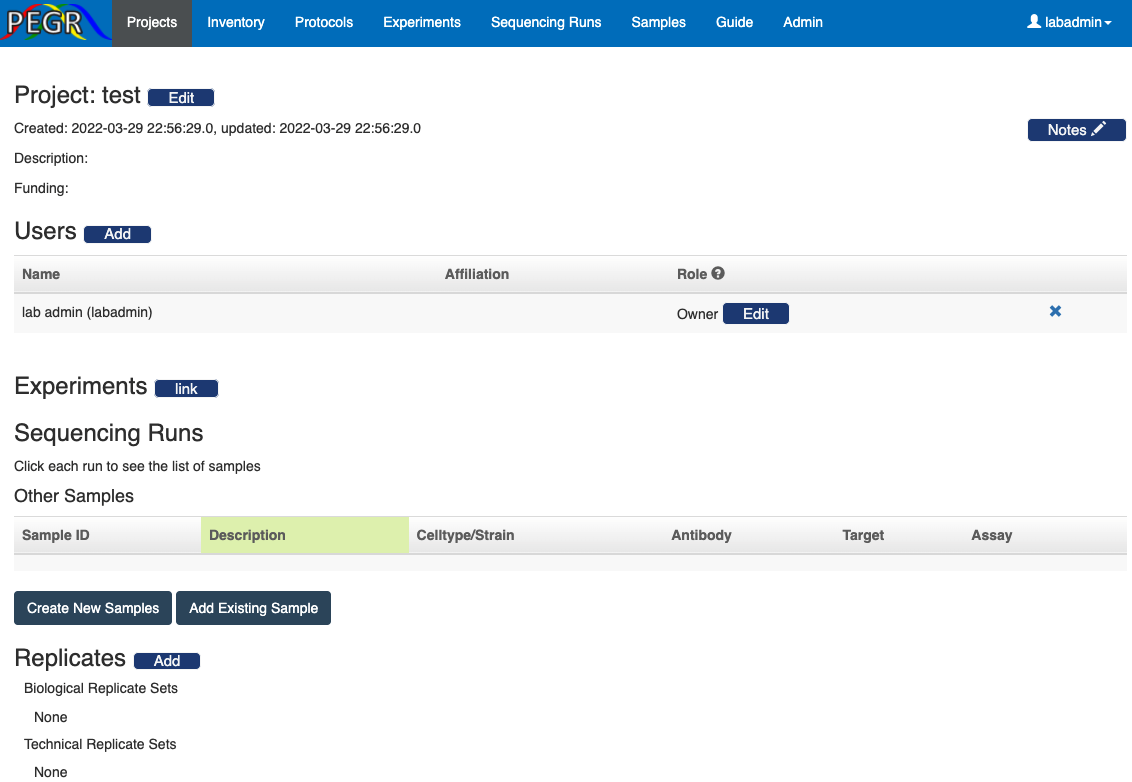
They (and admin users) can then add more users to the project and assign project roles to the added users. By default, the user who created the project will be an owner of the project.
Project Roles
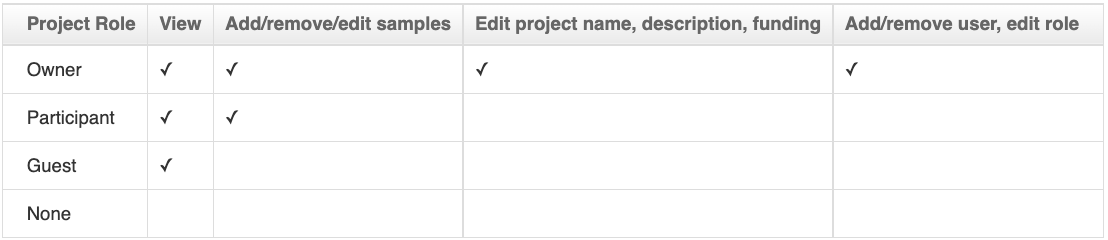
Note that:
- These permissions are per project, i.e. an "Owner" in one project may be a participant in another.
- Platform-wide admins also have all the authorizations to any project (the same access level as a project owner), and platform-wide members have all the read access to any project (the same access level as a project guest).
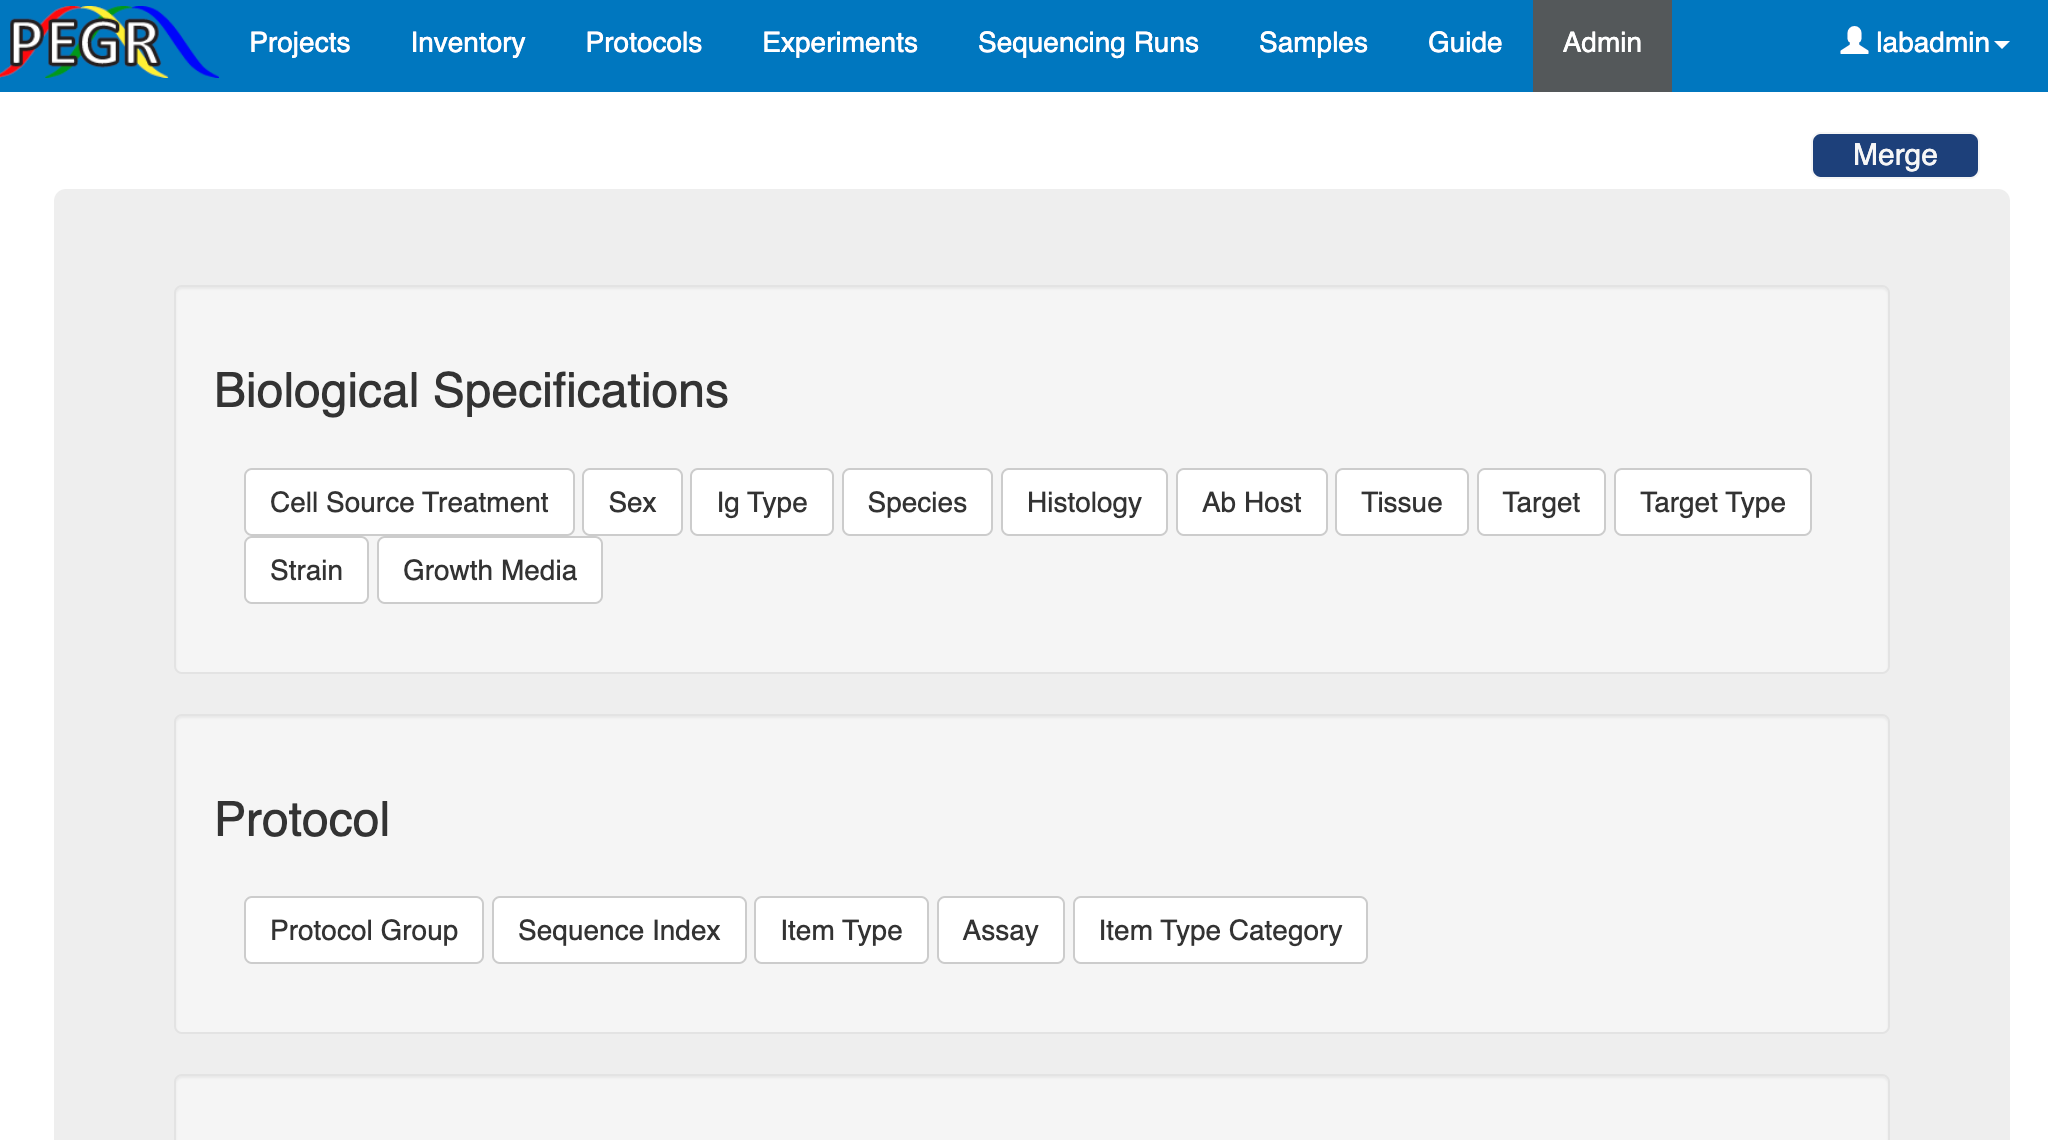
The Admin Console, which is accessible to admins only, hosts the lookup tables for many elementory components in PEGR, including
Biological Specifications: Cell source treatment, sex, IG type, species, histology, AB host, tissue, target, target type, strain and growth media;
Protocol: assay, protocol group, sequence index, item type, item type category;
Alignment and analysis: pipeline, reference feature, align type, aligner, sequence platform, genome and read type;
Other: role, role group, funding, organization, user, definition.
These lookup tables facilitate the standardization of the inputs. Once a PEGR instance is set up, it's usually the first thing for the admin to visit the Admin Console and update the lookup tables. Each lookup table follows the CRUD (Create, Read, Update and Delete) convention. Take the "Item Type" lookup table for example. First, click the "Item Type" tab on the Admin Console and it will take you to the list of existing item types. On the top-right corner, there is a search widget, where you can search an item type by its fields such as name and category.
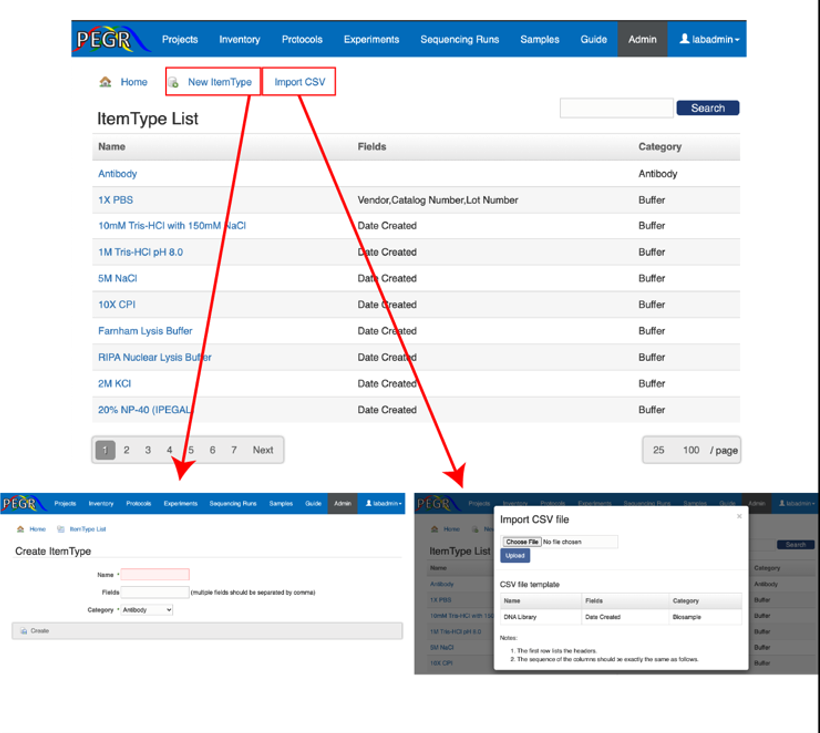
If you want to create a new item type entry, click "New ItemType" button on the top of the list page. Input the values and click "Create" to save the new item type. Note that there is a field named "Status", which can be used to indicate if the entry is being actively used or obsolete. If there are errors in your inputs, e.g. missing value or a unique value already exists in the database, those errors will display on the top of the page. When all the input values are valid, the new instance will be saved to the database and you will be taken to the page that shows the newly created item type. At the bottom of the page, there are buttons that take you to edit and delete the item type.
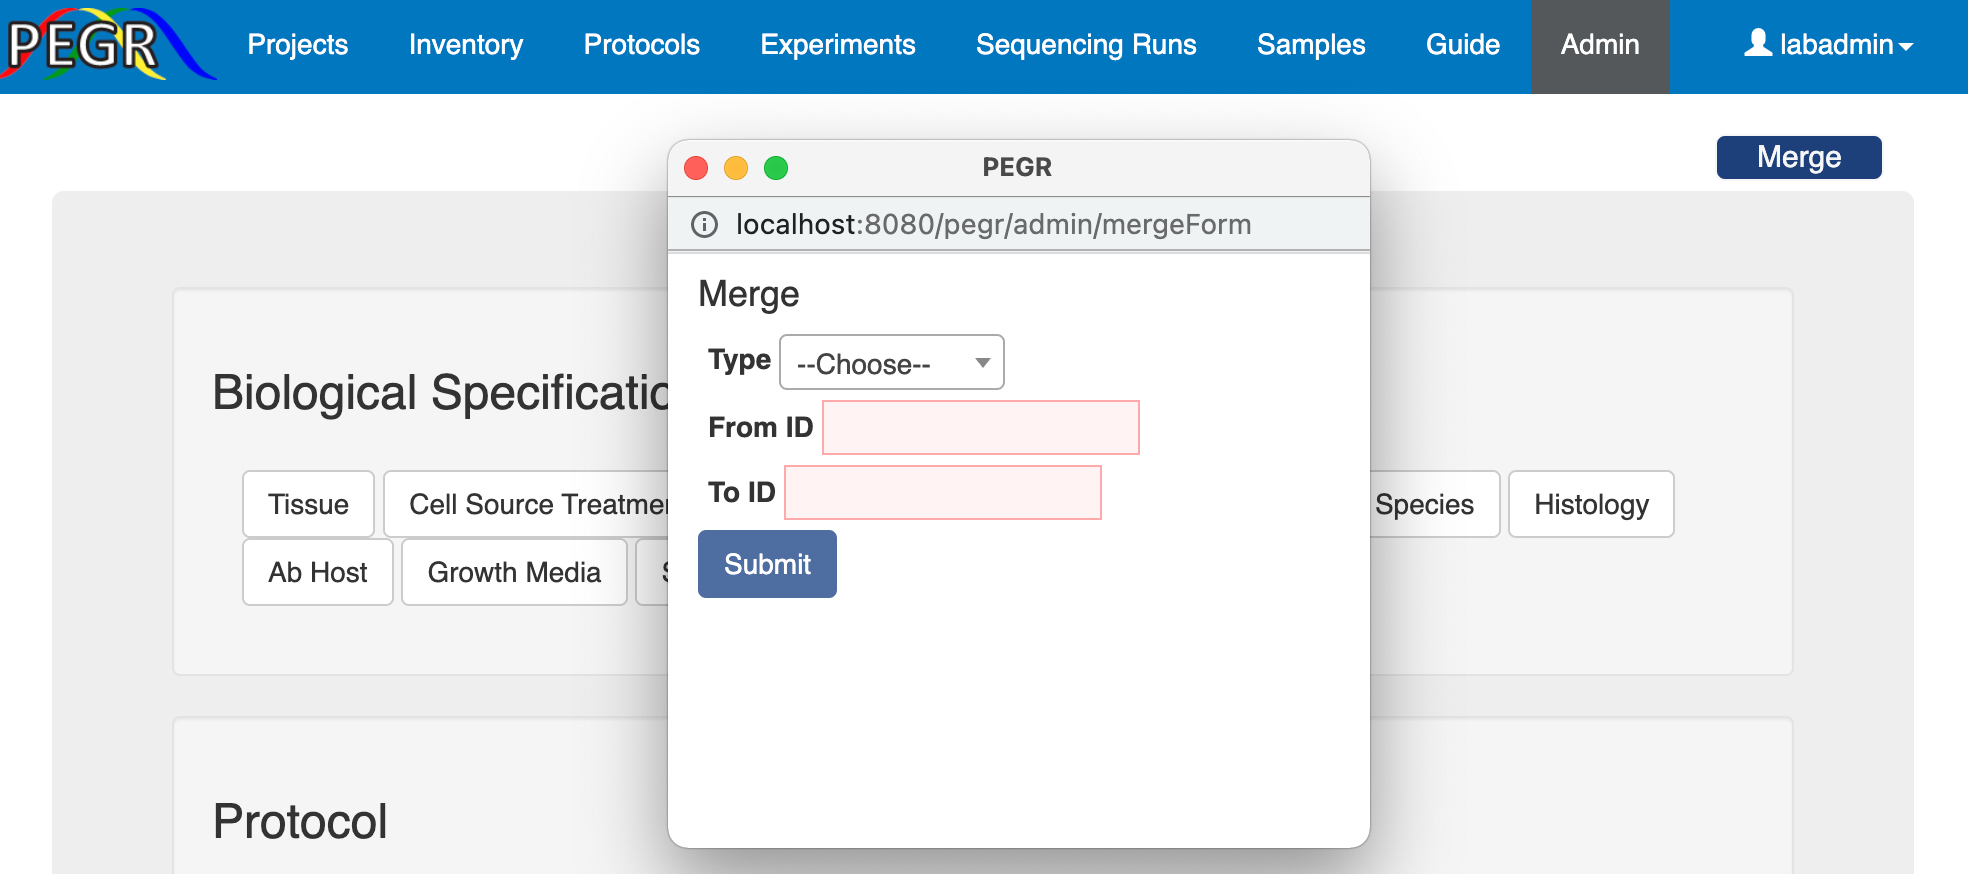
There could be errors during data entry and sometime both the correct entry and an erroneous entry coexist in the database. In this case, you may want to merge the erroneous entry into the correct entry. PEGR provides a "Merge" button at the top-right corner of the Admin Console's home page. This widget applies for entries in AB host, growth media, IG type, sex, species, strain, target, target type, tissue and assay, and when the admin knows the ID of the entries to be merged. Once the form is submitted, all objects linked to the erroneous entry (from) will be linked to the correct entry (to), and then the erroneous entry will be deleted.
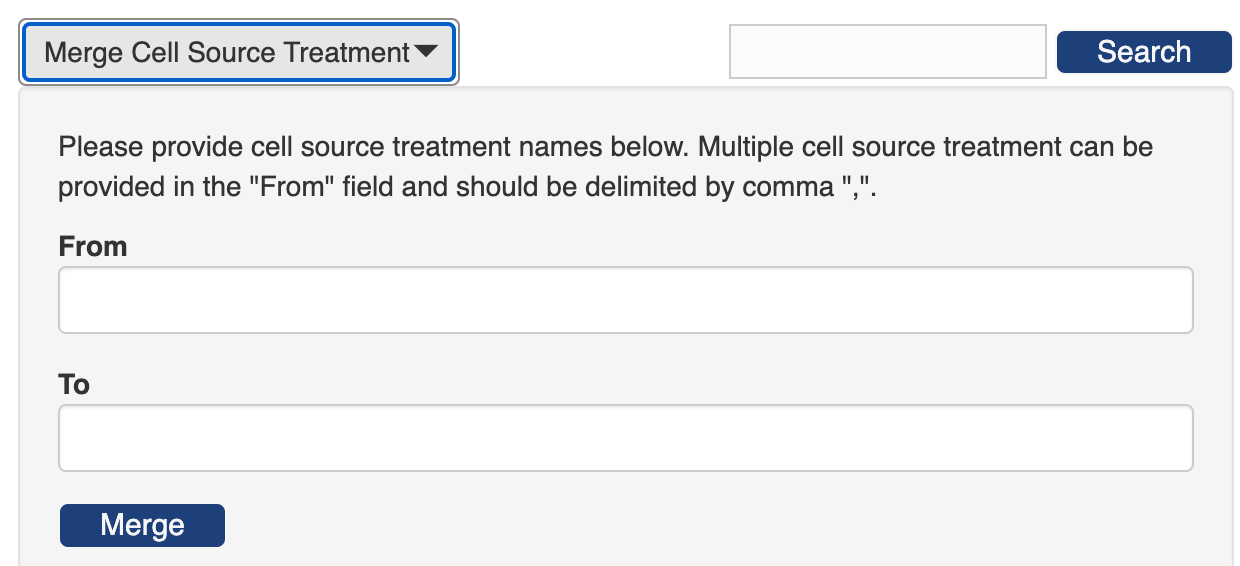
PEGR provides additional merge widgets in the individual lookup tables ofuser, strain, species, genome, tissue, target type, growth media, cell source treatment, IG type and AB host. In these widgets, you can merge multiple entries by name.
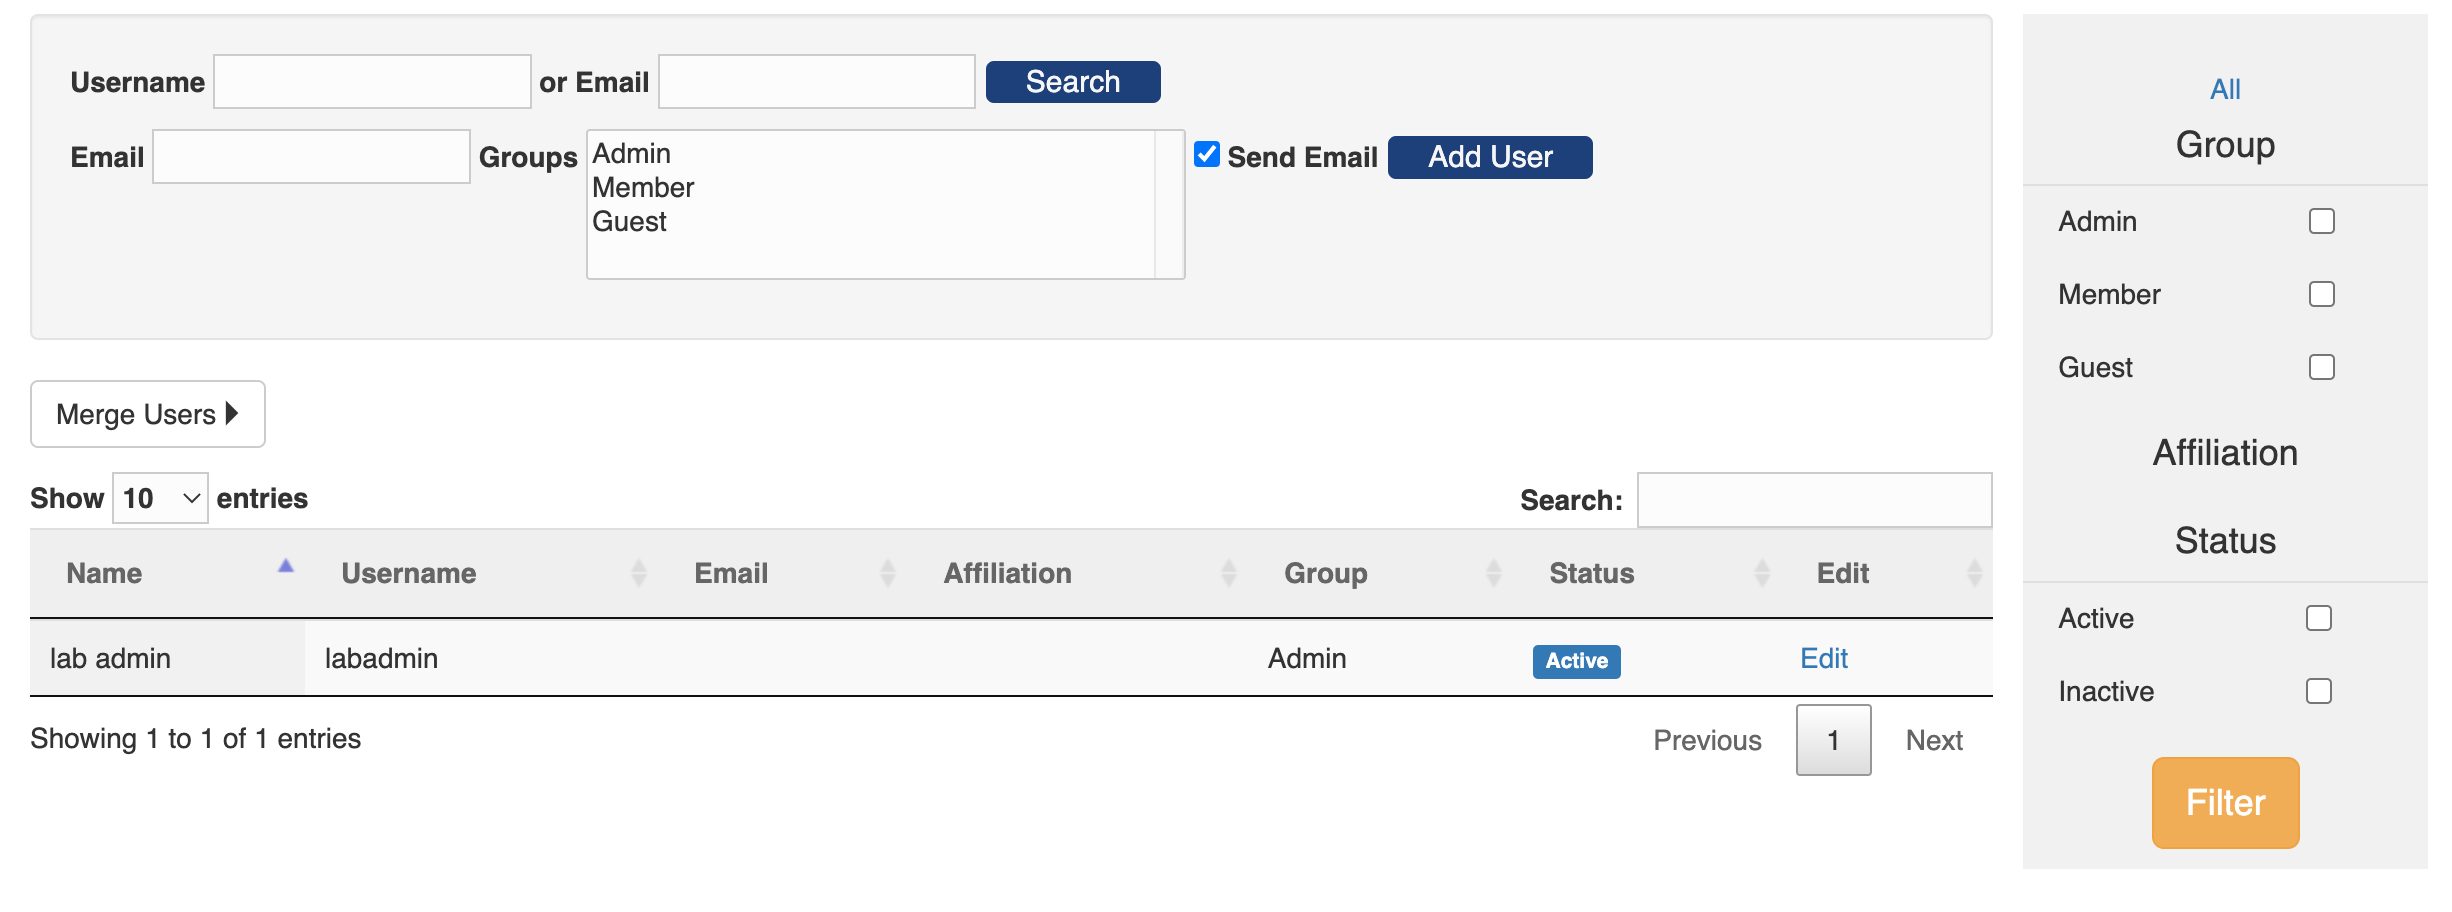
From the home page of the Admin Console, click the "User" tab and you will see a table of existing users. On the upper-right corner of the table is a search bar that you can search a user by any field in the table, e.g. name, username, email, affiliation or group. And there is a side bar to the right of the table where you can filter users by group, affiliation and status.
Users can login PEGR through two ways: either password enabled login and single sign-on (see here for how to configure single sign-on). Catering for the two login modes, PEGR provides two ways to create a user.
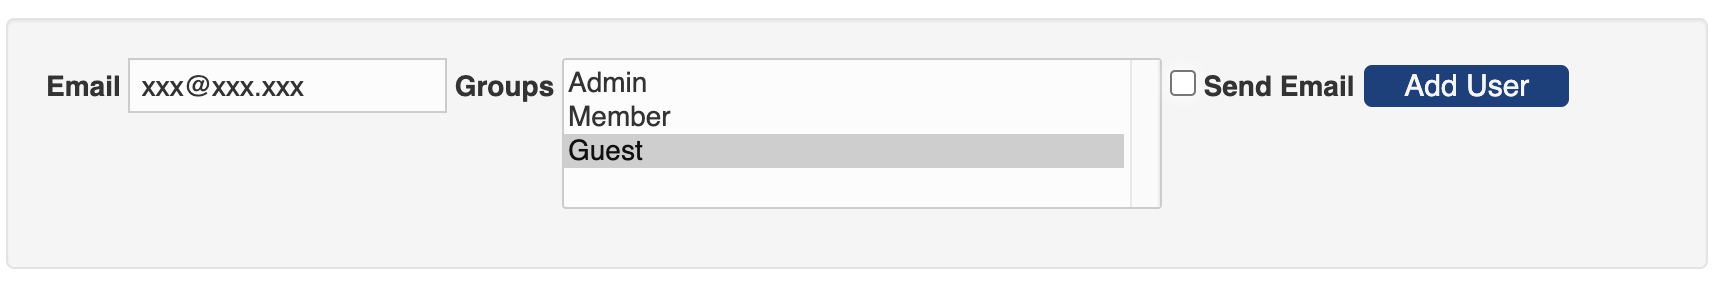
- If the new user will login through single sign-on, the admin can simple add the user without sending out an email. To add a new user, input the new user's email, select the user's group, uncheck the "Send Email" box, and click "Add User." The newly created user will have a username the same as their email address and a randomly assigned password (since the password won't be needed during single sing-on).
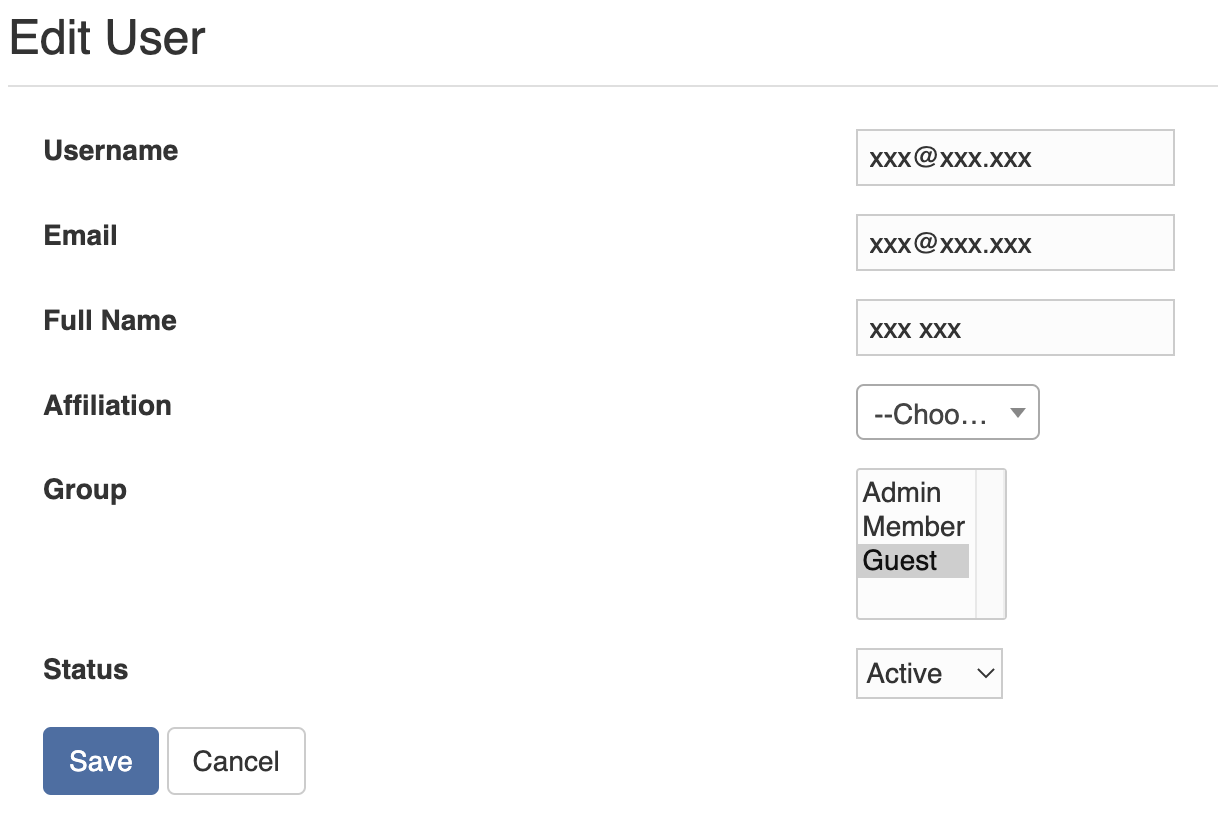
Once a user is created, the admin can further edit the user's information, such as name and affiliation.
- If the new user will login by password, the admin needs to check the "Send Email" box when creating the user (see here for how to configure the email server). Once the admin clicks the "Add User" button, an email as below will be sent to the new user.
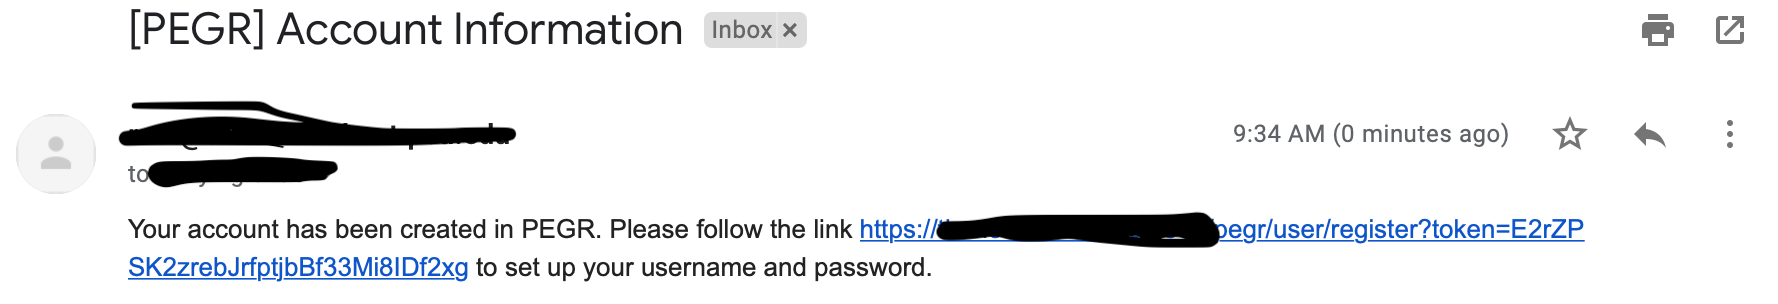
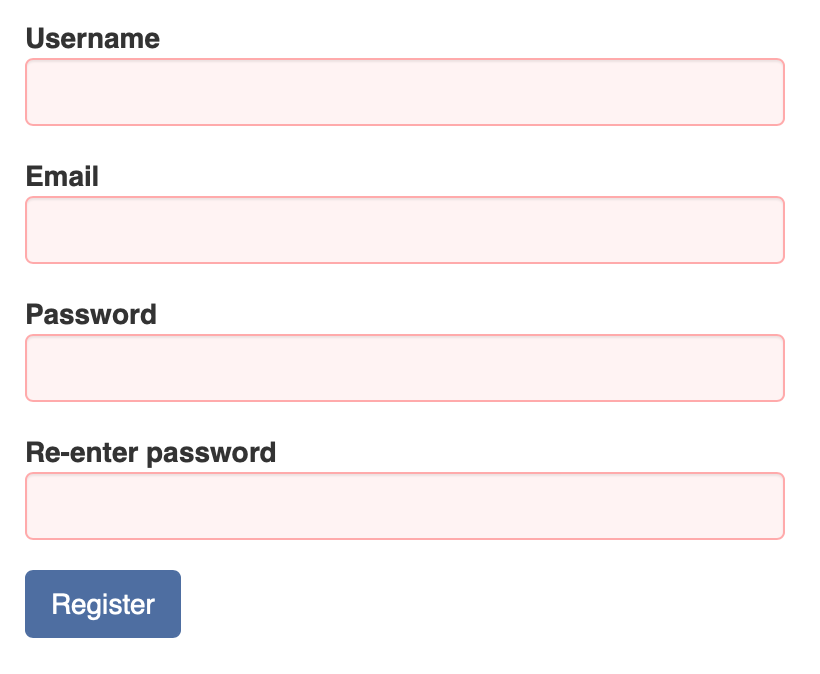
The user then follows the link in the email to register at PEGR.
The inventory has many types, including antibody, chemical, enzyme, cell stock, biosample, sample pool and others. In PEGR, barcodes are used to track the inventory. Note that the barcodes have to be UNIQUE for each item type. To use the barcode tracking system in PEGR, you need an android phone or tablet with the "Barcode Scanner" app (based on zxing) installed from the Play Store.
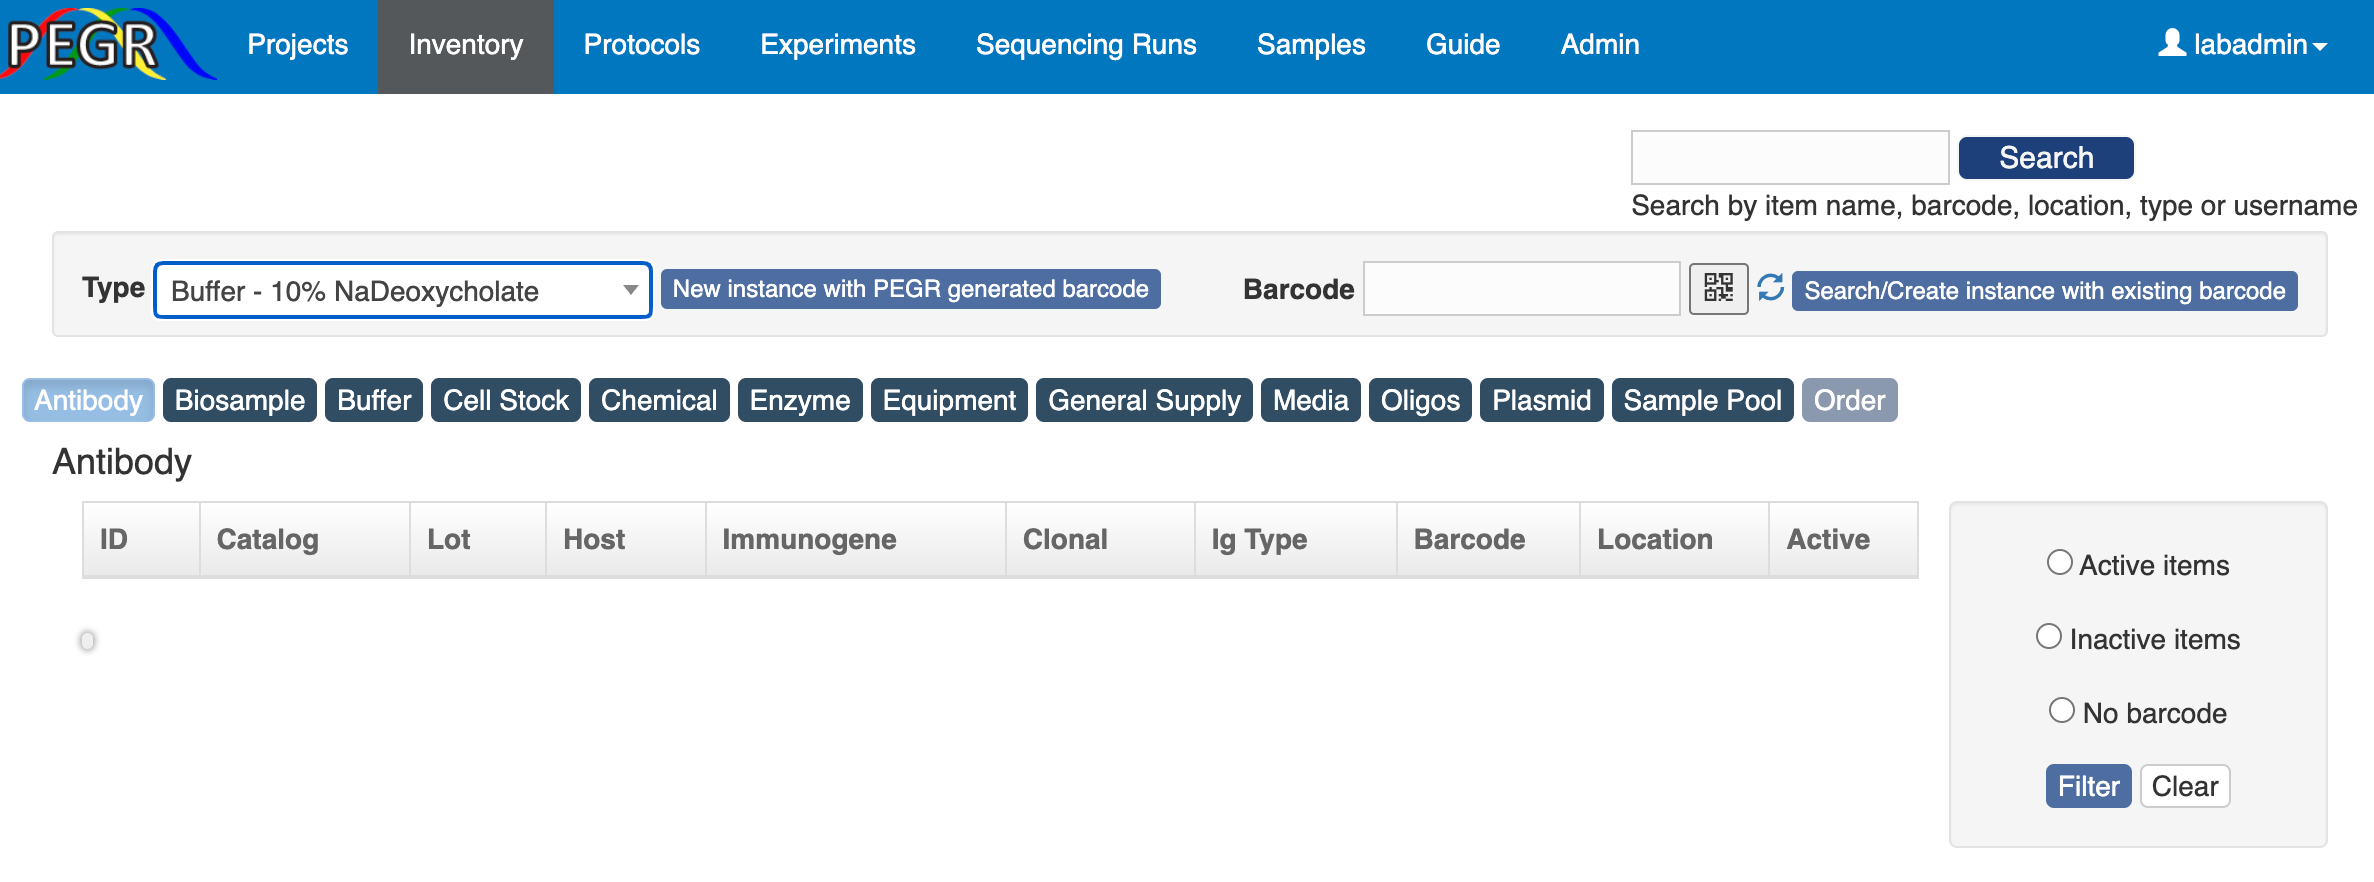
To create a new inventory item in PEGR, first go to the “Inventory” tab and find the top banner. If the item does not have a barcode yet, select type at the right, and click the "New instance with PEGR generated barcode" button.
You will see a page showing the item type and barcode.
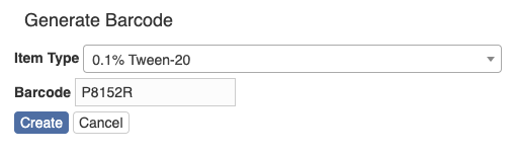
Click “Create” and there is a page for you to fill in more information, e.g. name, location and notes.
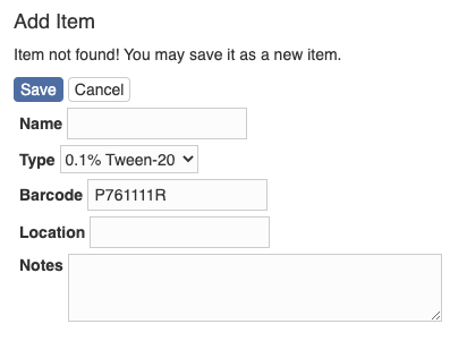
After filling in the information, hit the button “Save” and you will be taken to the page showing the item.
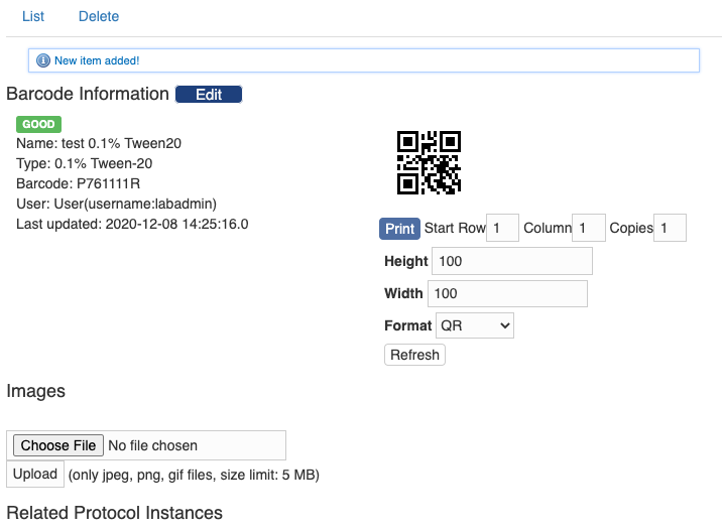
You can further upload images and print the barcode here.
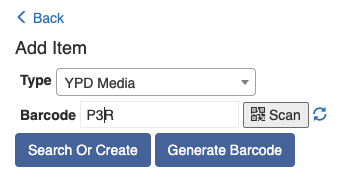
If the item already has an attached barcode, you can scan the barcode into PEGR on your mobile device. Select “Type” and then click the barcode icon.
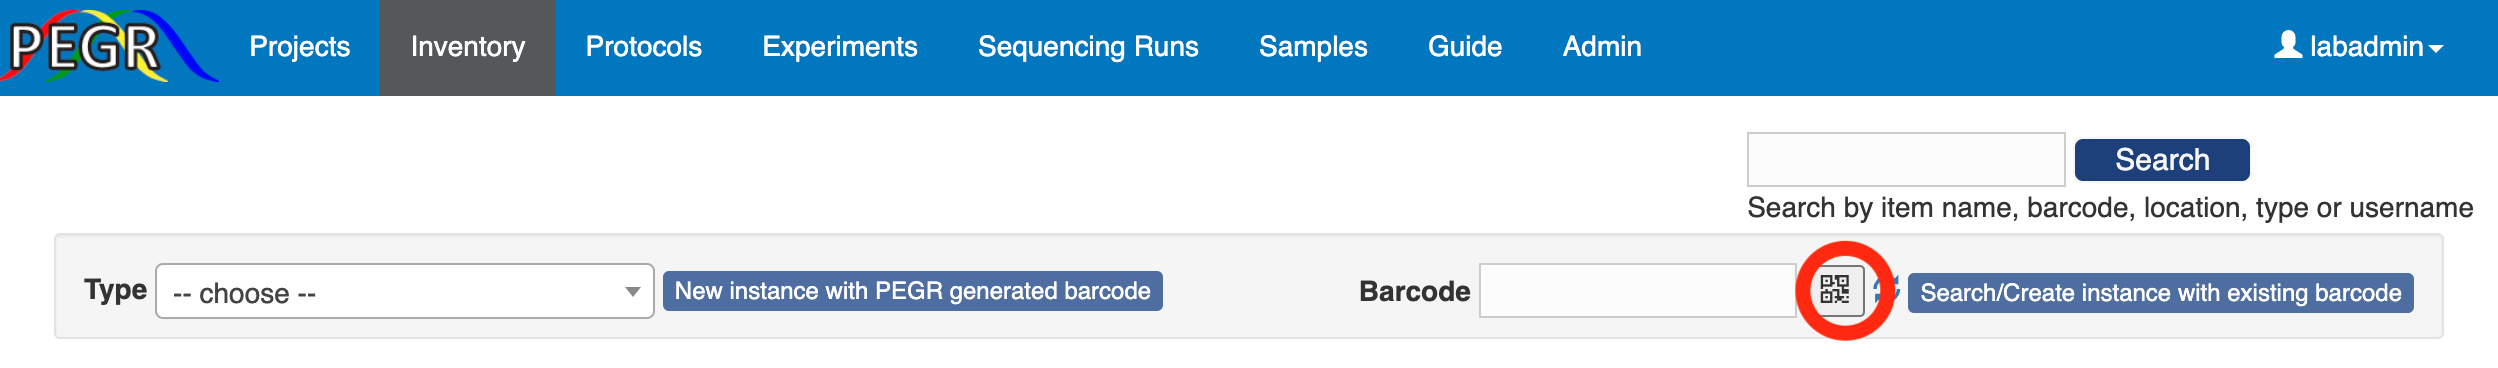
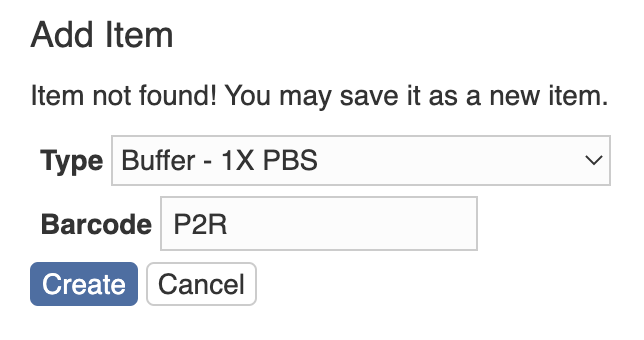
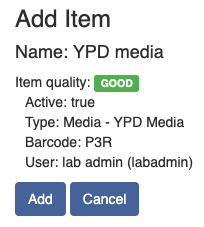
You will be taken to the barcode scanner app. Scan the barcode and you will be taken back to the PEGR page. Then click the “Search/Create Instance with existing barcode” button. If the scanned barcode already exists in the database, the item with the barcode will show up; otherwise, you will see a page to add the scanned item to the database. First, you need to select a type. And then you can add more information (e. g. name, location and notes) to the item.
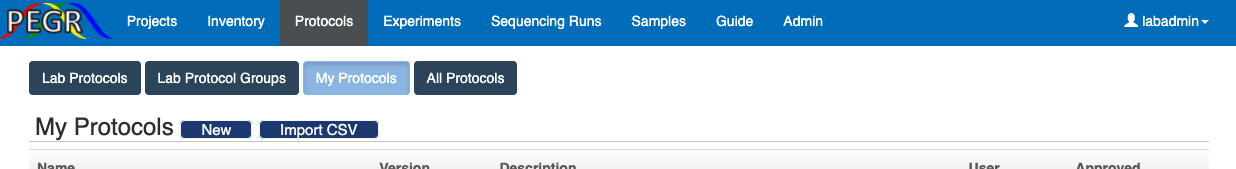
A protocol is the standard for one experiment step. For example, some chemicals are mixed to create an end product, a cell stock is processed to another state, or a batch of biosamples are pooled. To create a protocol, go to the tab “Protocols” and then “My Protocols”. You can either import a protocol from a CSV file by clicking the "Import CSV" or create a protocol at the user interface by clicking the button “New”.
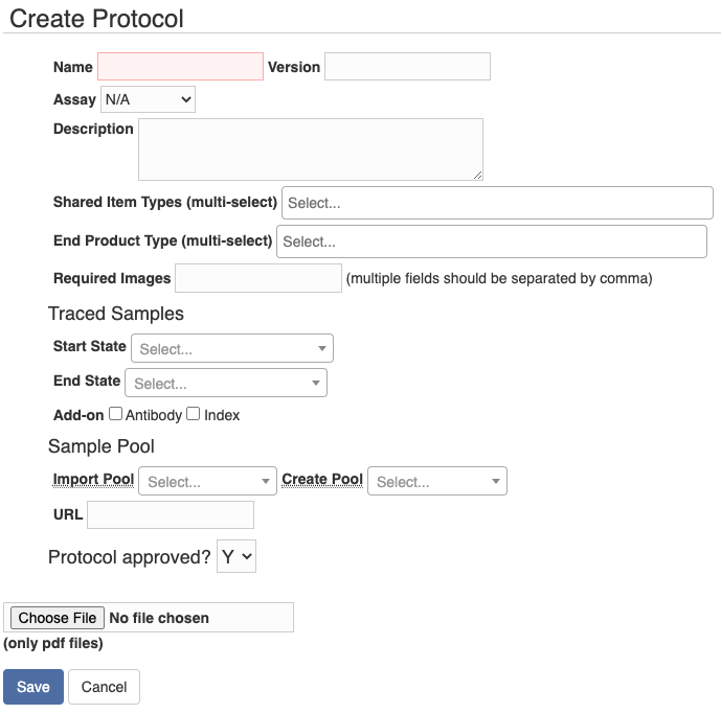
On the “Create Protocol” page, you can fill in the information about the protocol. The shared item types and end product types could be certain types of chemicals and reagents, and you want to barcode and track those items during the experiment. The traced sample may change from one state to another state during an experiment step. Sometimes the sample is transferred from one container to another container, or a partial portion of the sample goes to the next state. In these situations, you might want to have different barcodes for different states of the sample, and you can specify the “Start State” and “End State” of the traced sample. If a pool is created in the step, you can specify “Create Pool” type. And if a pool is processed and transforms to another state, you can specify both “Import Pool” and “Create Pool” types. The “URL” field allows you to link to another webpage, and you can also upload a PDF file of the protocol.
Users can see the protocols that they created in the “My Protocols” tab. Protocols that are “approved” (often by the lab admin) will also be listed in the “Lab Protocols” tab. In addition, lab admin can view all the protocols in the “All Protocols” tab.
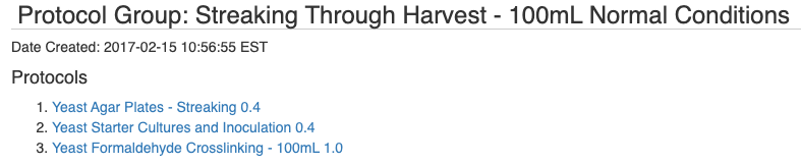
There is also a tab named “lab Protocol Groups”. A protocol group is an ordered list of protocols that happen in sequence. In practice, some protocols often go together and the protocol group is a convenient tool of creating experiment records.
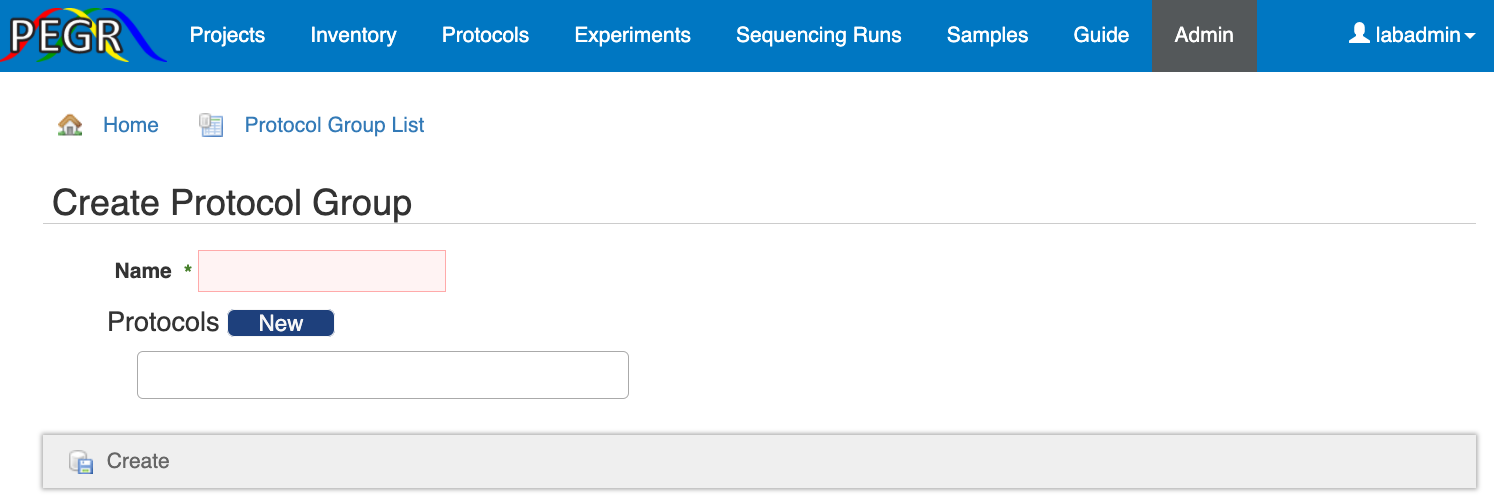
The protocol group is created in the Admin Console. Go to the “Admin” tab and find “Protocol Group” in the “Protocol” section. Follow the "New ProtocolGroup" link to create a protocol group.
An experiment record is a record of one or more steps of experiment. It records the protocols followed and the barcoded items (chemicals, reagents, samples, pools) used during the experiment.
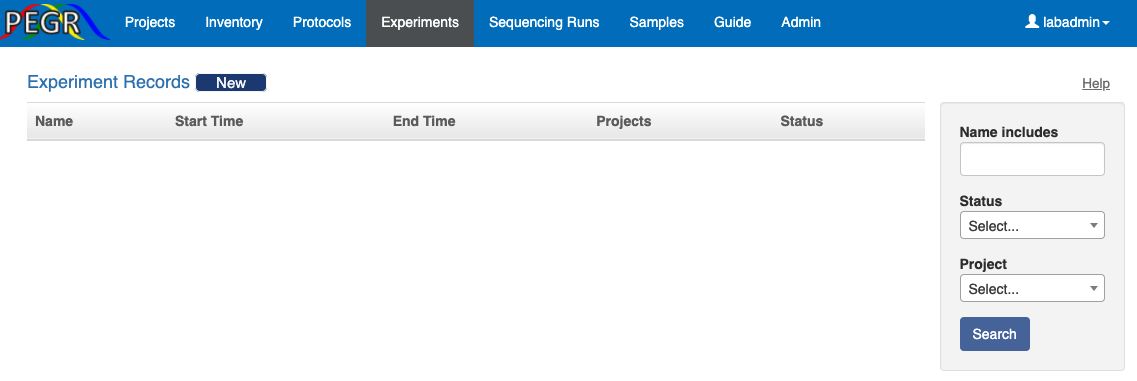
To create an experiment record, go to the “Experiment” tab and click the “New” button at the top, and you will be taken to the following page. Here you can either select a protocol group or a list of protocols. You can select one or more projects here, and then on the view page of the experiment record, you can further assign each sample to a project.
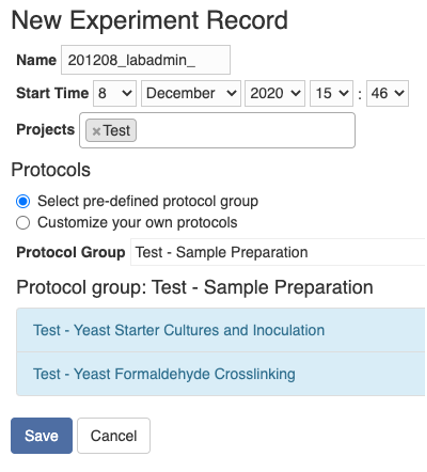
Once the experiment record is saved, you will be taken to the view page of the record. The left panel lists the protocols as you defined before and the right panel is for you to add samples to the experimennt. Note that on a smaller screen, e.g. on a mobile device, the right panel will be stacked below the left panel.
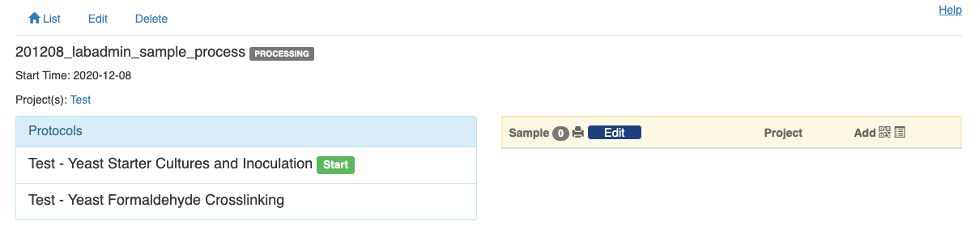
You will notice that there is a "Start" button next to the first protocol on the left panel. That will take you to the details of that experiment step. But before clicking the “Start” button, you need to add all the samples in the experiment and you will be reminded by a warning message. There are two ways to add samples. The first is to click the symbol and scan the sample's barcode using your mobile device.
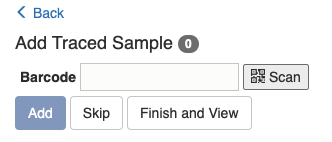
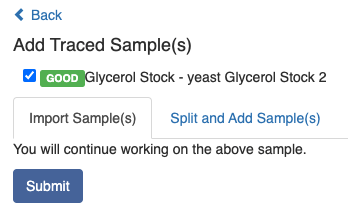
Once you have scanned and found the sample, you will be asked to confirm if you want to "Import Sample(s)" or "Split and Add Sample(s)". The second option applies if you only want to take part of the existing sample for processing and the rest part will be kept for future use. If the second option is chosen, a new barcode will be created for the portion that will be used in the experiment.
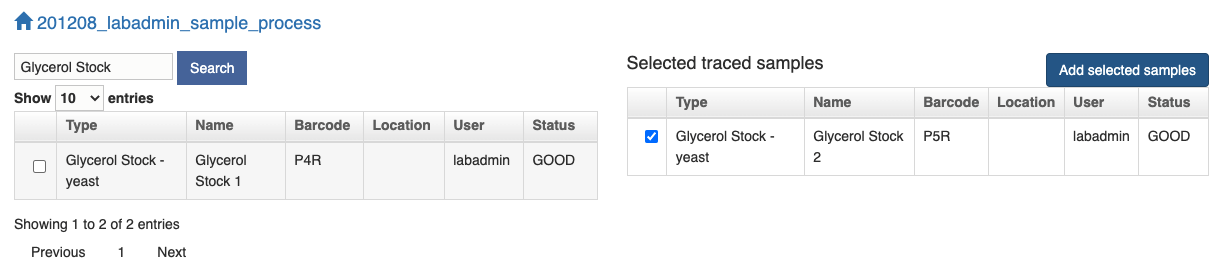
The other way to add samples is to click the Menu symbol and search by typing the related information, e.g. sample type, name, barcode or location.
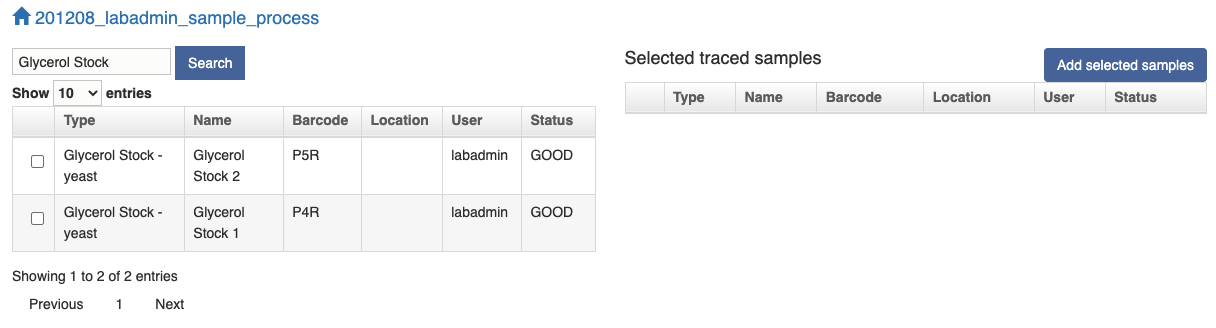
Once you find your sample in the left table, click the checkbox and the sample will be added to the right table. Click the "Add selected samples" button and the samples in the right table will be populated in the next page where you can choose either to "Import Sample(s)" or "Split and Add Sample(s)" as above.
When all the needed samples have been added to the experiment, you can click the green "Start" button and start tracing the experiment.
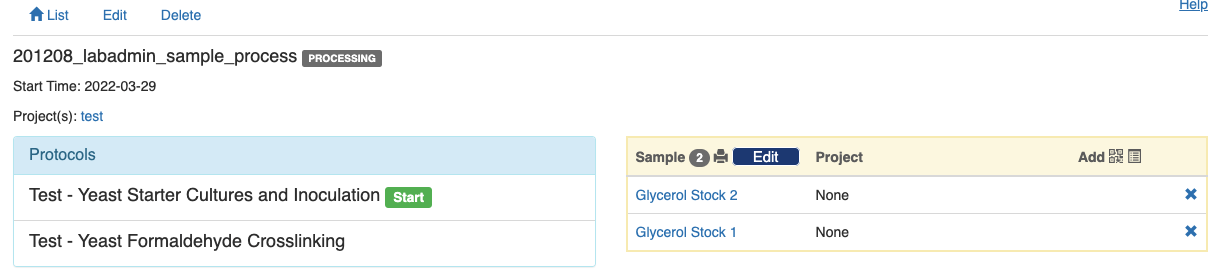
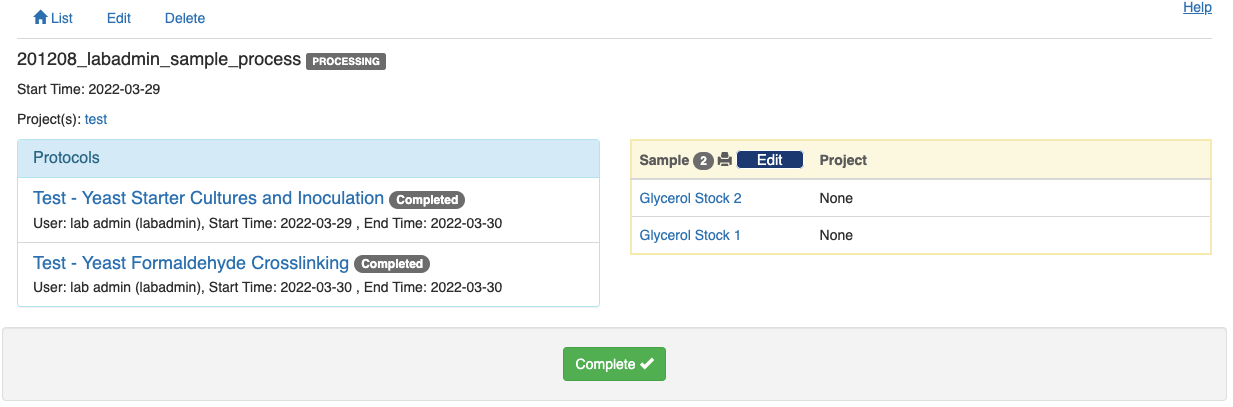
Once you have added all the samples to the experiment, click the “Start” button next to the first protocol, and you will see the following page.

If the protocol has defined types for the shared items, end product, samples' start and end state, and imported or created pool, each of these types will be expanded as a table for you to track the respective items. For example, if the protocol requires a shared item with the type "YPD Media", there will be a "Shared Items" table with a row for the type "YPD Media". You then scan the corresponding item to that row by following the "+" sign.
Once all the required fields are filled in, the grey "Processing" button at the bottom will turn into a green "Complete" button.
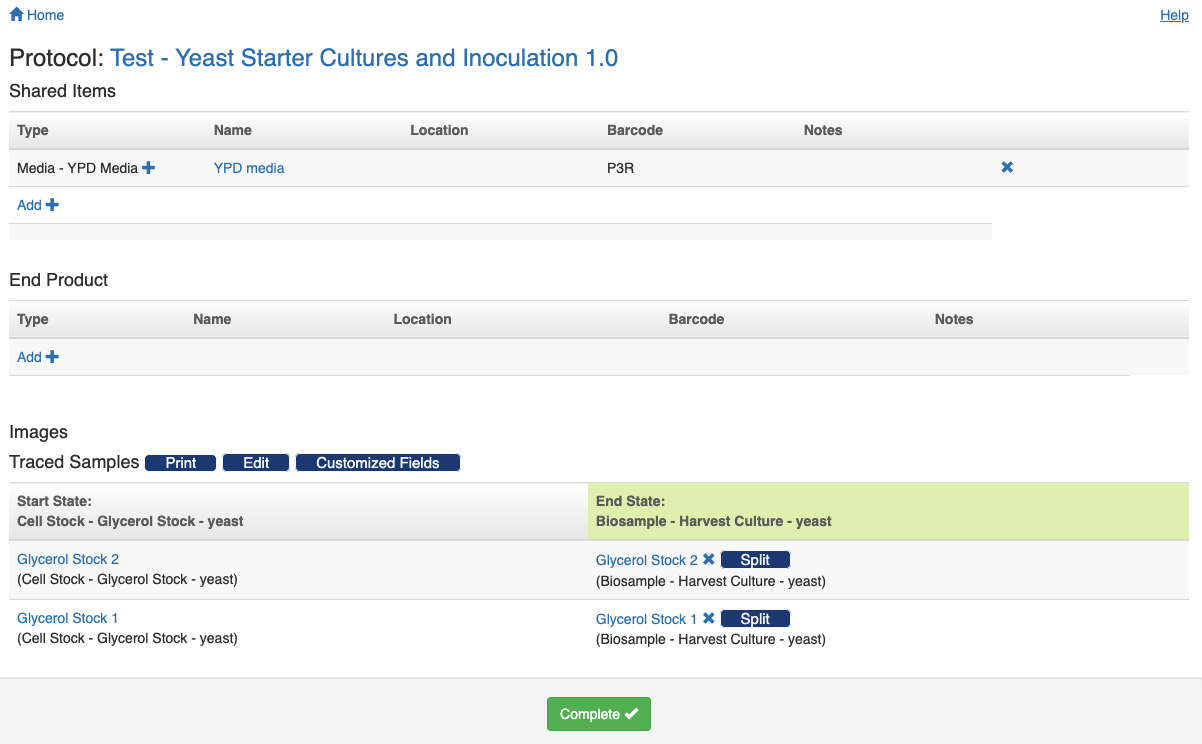
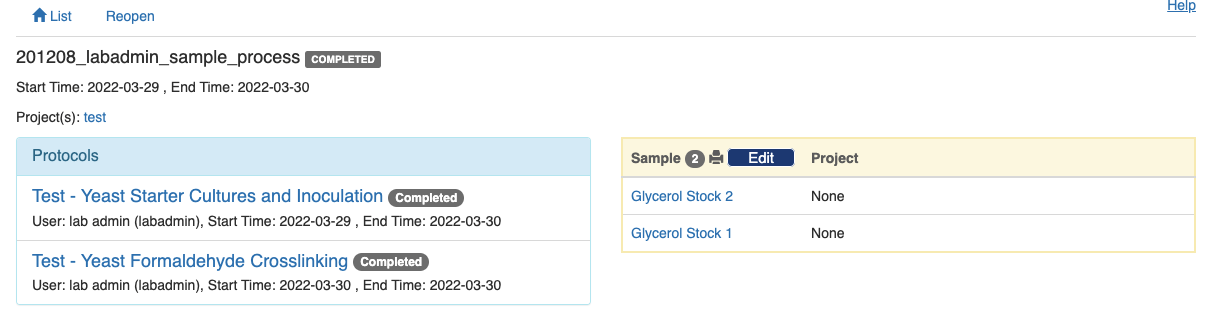
Click the green button to close this step and return to the experiment's summary page. You will notice that the first protocol is now labeled as "Completed" and a green "Start" button appears next to the second protocol.
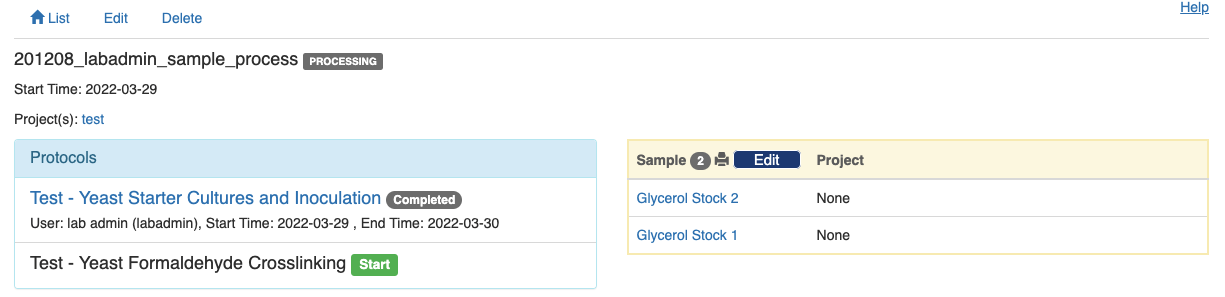
Complete all the protocols in sequence, and a green "Compleete" button will show up at the bottom of the summary page. Click the green button to indicate that the entire experiment has completed.
Note that no change can be made to the experiment record afterwards unless an admin reopens the experiment record.
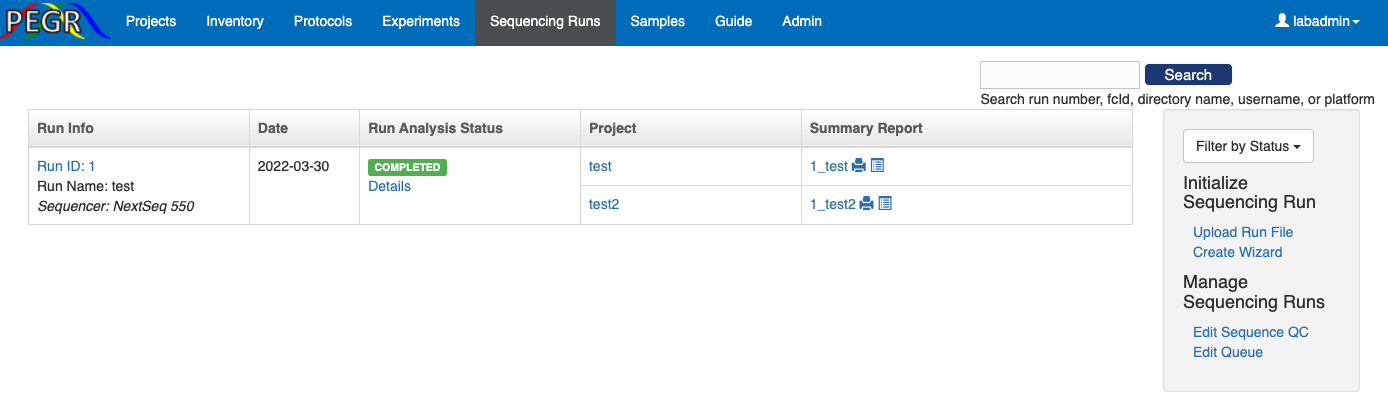
The dashboard of Sequence Runs features a table for all the sequence runs, a search bar on the top-right corner, and a side bar on the right for widgets to initiate new sequence runs and manage settings.
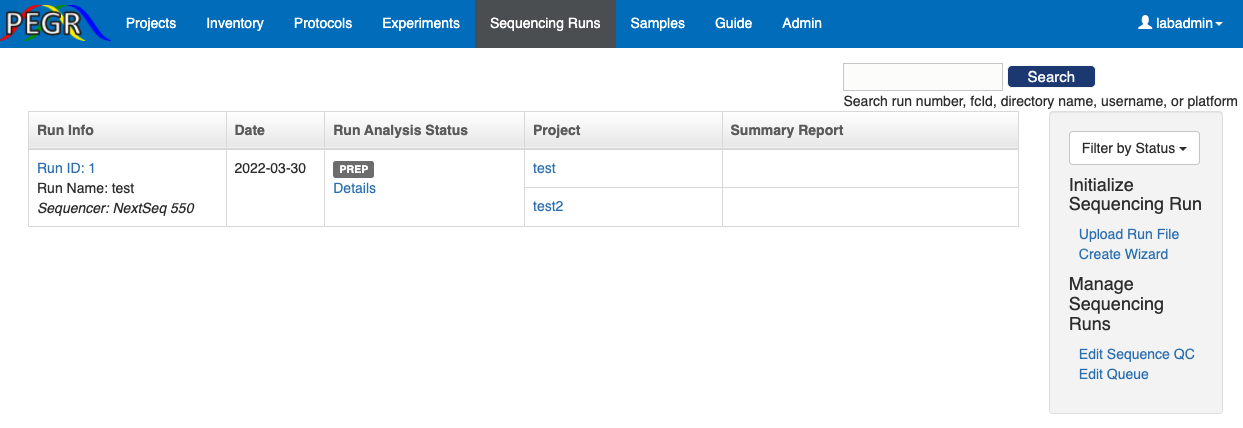
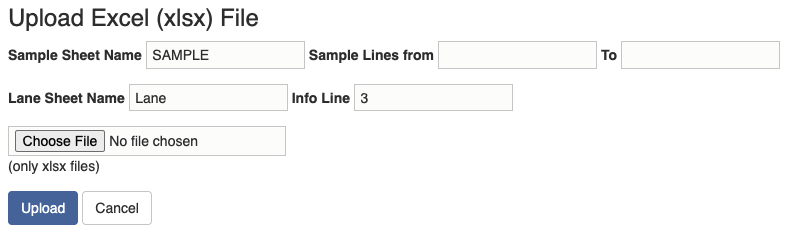
There are two ways to initiate a sequence run. One way is to upload a sample submission form (run file). A template sample submission form is provided here. The sample submission form is an excel file, and it contains two sheets: sample sheet and lane sheet. In the "Upload Run File" widget, you need to specify the lines of samples that you want to import in the sample sheet and the line in thee lane sheet that contains the information about the sequence run.
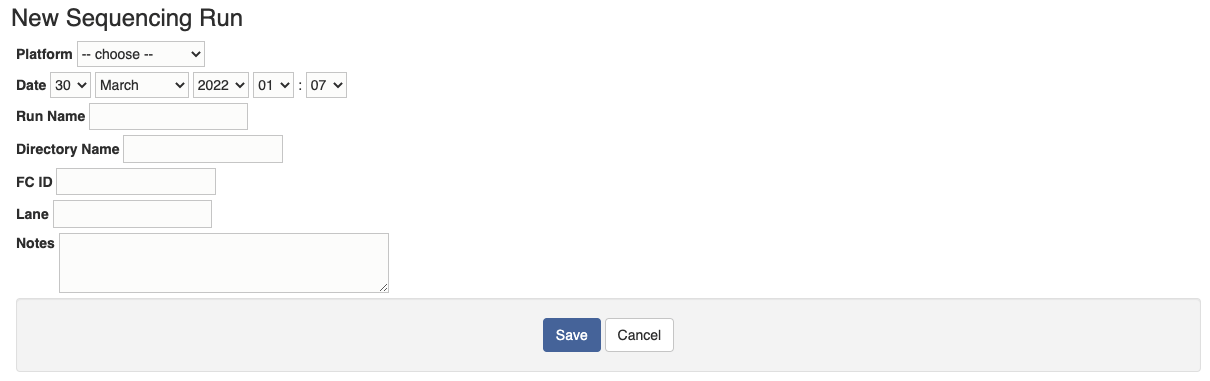
Another way to initiate a sequence run is to use the "Create Wizard". First create a sequence run by inputing the sequencing platform and run name along with other information if available.
Once a sequence run is created, add samples related projects to the sequence run. Note that samples from multiple projects could be pooled together and go into the samplee sequence run. The group of samples that belong to the same sample project and sequencing run is defined as a "sequencing cohort".
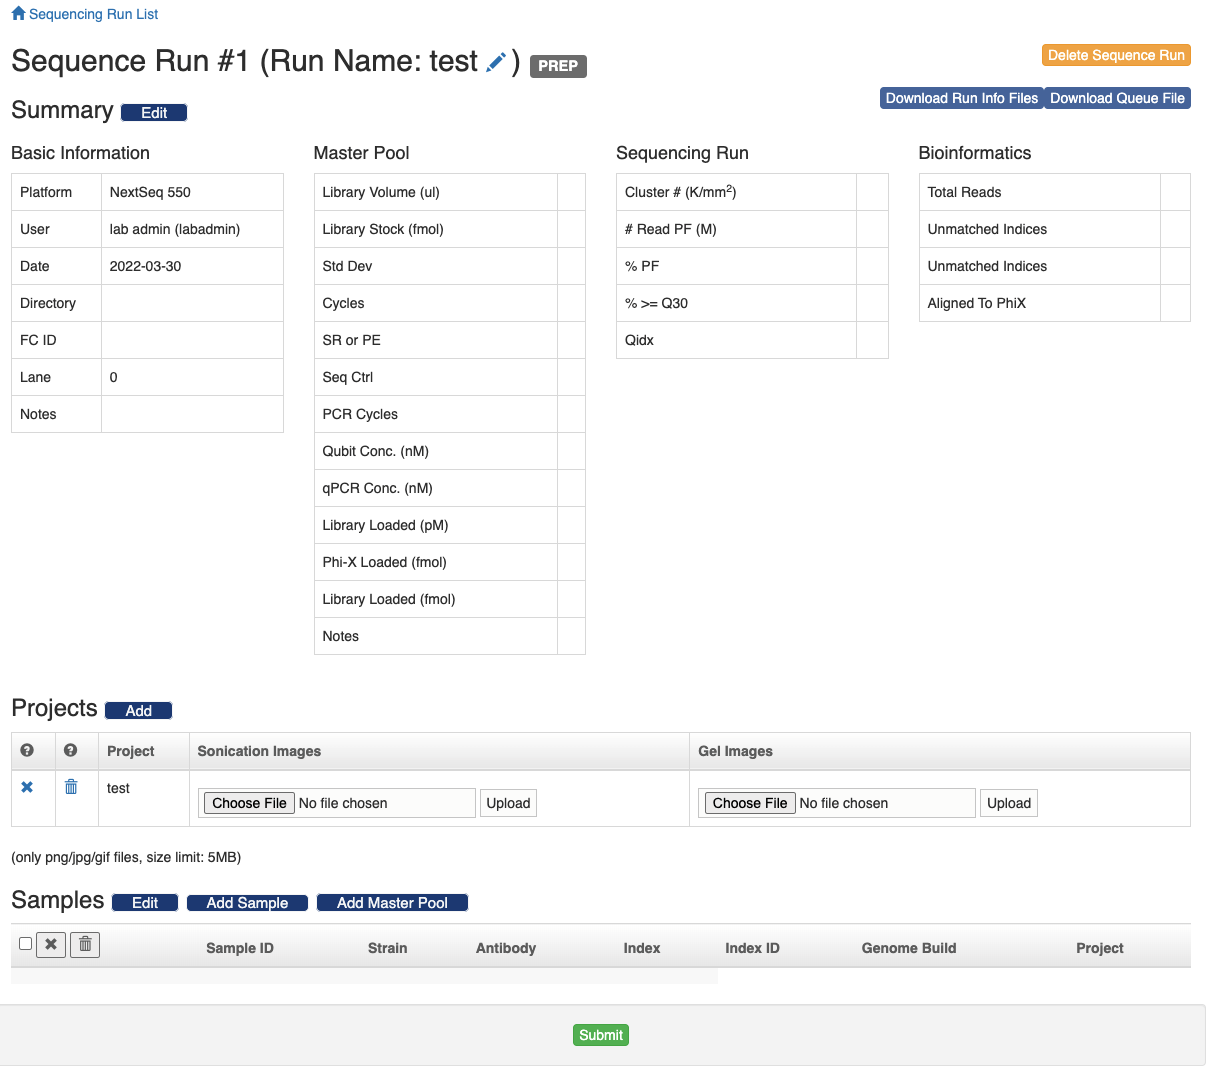
There are two ways to import samples to the sequence run. One is to follow the "Add Sample" button and input the sample ID's. The other way is to follow the "Add Master Pool" button and scan the master pool's barcode. And all the samples in the master pool will be imported to the sequence run. The sample's project can be changed in the sample table. Just click the project text, a form will show up in the same cell. Select the project and click the "Save" button.
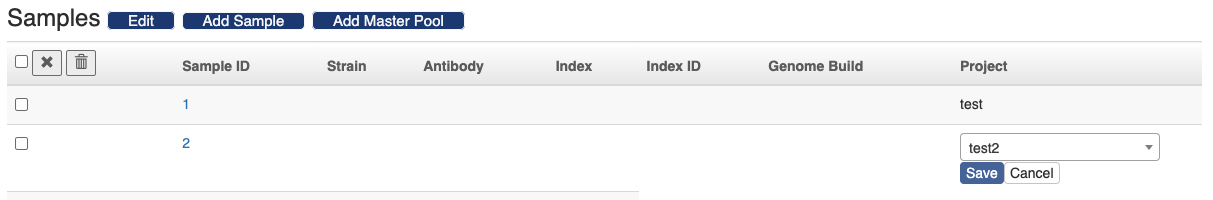
You can also remove samples from the sequence run. Select the samples and click the icon to only remove the samples from the sequence run and the samples themselves will be preserved. Click the icon and the samples will be deleted from the database altogether.
When a sequencing run has just been created, it's in the "PREP" status and there is a green "Submit" button at the bottom of the page. Once you click the "Submit" button, the status of the sequence run will changee into "QUEUE" and the information about the sequence run and included samples will be compiled into a set of files and those files will be deposited to the designated NGS repository. See the "ngsRepo" section of the wiki for instructions on how to configure the connection to the NGS repository.
PEGR can work with external data analysis pipelines such as Galaxy. The external data analysis pipeline needs to take over the run information files prepared by PEGR and send the analysis results back to PEGR via API's. Detailed instructions and scripts on how to connect to Galaxy can be found in the following links:
- Retrieve and Preprocess raw data: https://github.com/CEGRcode/pegr-ngs_pipeline
- Send analysis results (metadata) back to PEGR: https://github.com/CEGRcode/pegr-galaxy_tools
Once the external analysis pipeline takes over the run information from PEGR, the sequence run's status will change into "ANALYZING". From the "Sequencing Runs" dashboard, click the "Details" link in the "Run Analysis Status" column, you can further view each analysis step's status of individual samples.
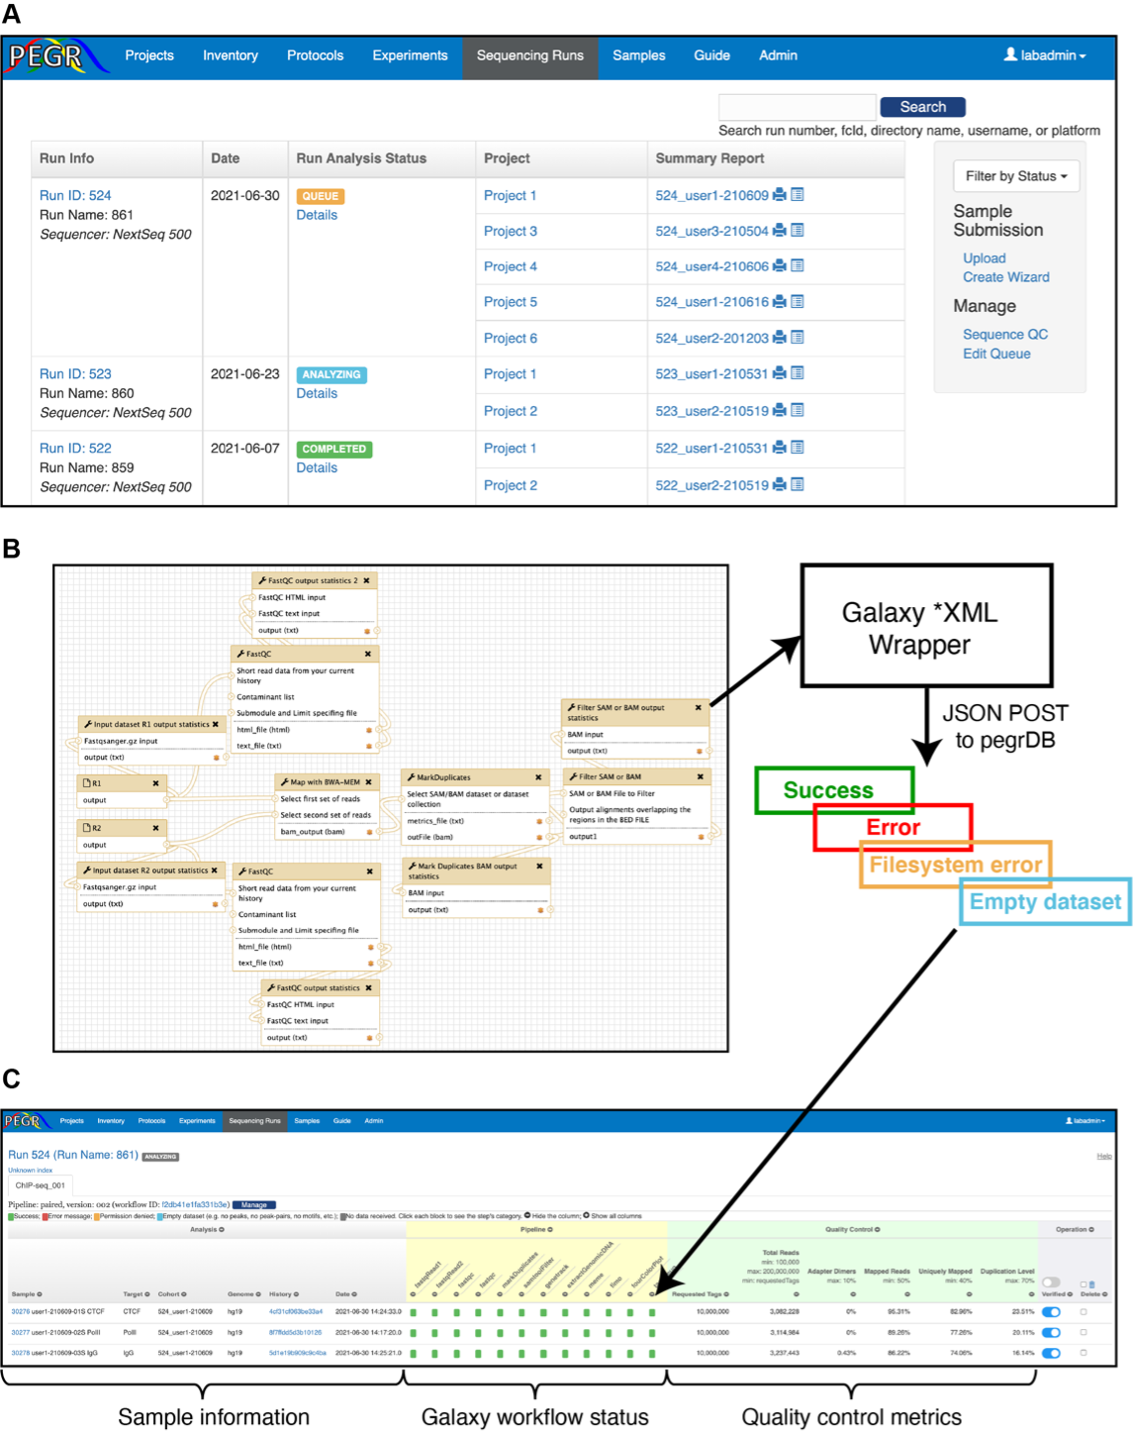
Each step in the pipeline is labeled with one of the following status
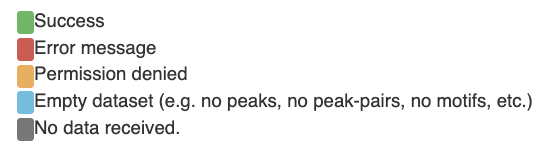
The status is determined by the messages received from the external bioinformatics workflow and preliminary screening of the data.
- The error messages from the external bioinformatics workflow are generally labed as Error message, except when the message contains "Permission denied", in which case , the step is labeled as Permission denied.
- Data received from the following steps are tested for Empty dataset bedtoolsIntersect: no peaks cwpair2: no peak pairs repeatMasker: no sequence in fasta meme: no motif
- If the motif count from fimo or tagPileup does not match the motif count in meme, the fimo or tagPileup step will be labeled with error. You can learn more about a step with data received by clicking the colored label. A snippet will pop over, including the step's name, error message and notes. An admin can change the step's status by clicking the inside the snippet and following the instructions.
Once all the data analysis is returned to PEGR, you can scan through the "Quality Control" pannel to verify the results. If no critical problem is found, you can change the status of the sequence run to "COMPLETED". At the bottom of the analysis status page, you can generate a report for each sequencing cohort by clicking the "Generate Report" button.
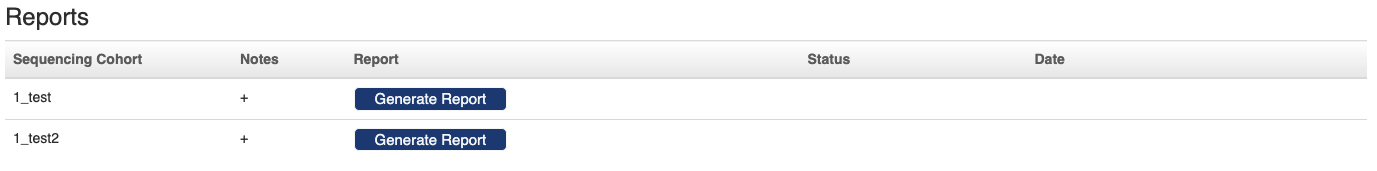
When you return to the sequence run dashboard, the links to the cohort reports will show up in the "Summary Report" column.
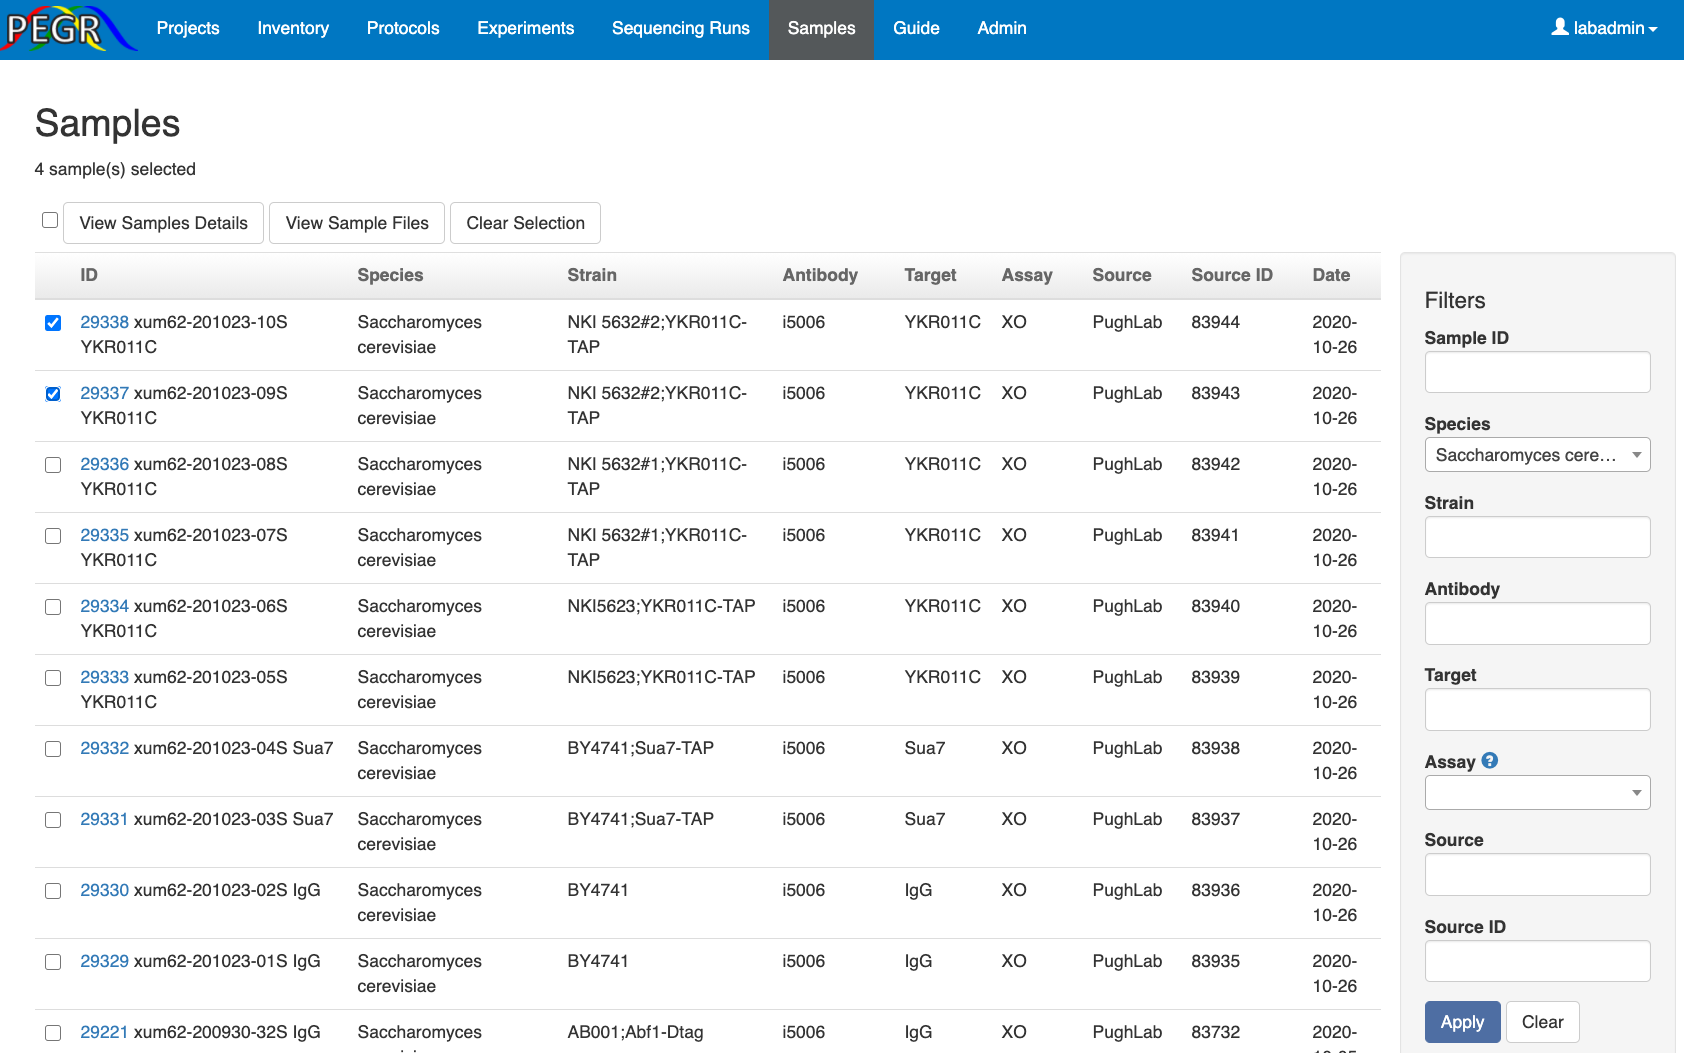
Under the "Samples" tab, you can view all the samples and search sampels by ID, species, strain, antibody, etc. You can click an individual sample and view the details for that sample. In adddition, you can select multiple samples, and view the selected sample together and compare.