Chromium trace file format exporter#1113
Merged
Merged
Conversation


Contributor
|
This is phenomenal @adamsitnik! I'm happy to see that experiment prove helpful 😃 CC - @tommcdon @sywhang: this will be a great new way to view traces on non-Windows (and Windows for that matter) platforms. |

Member
|
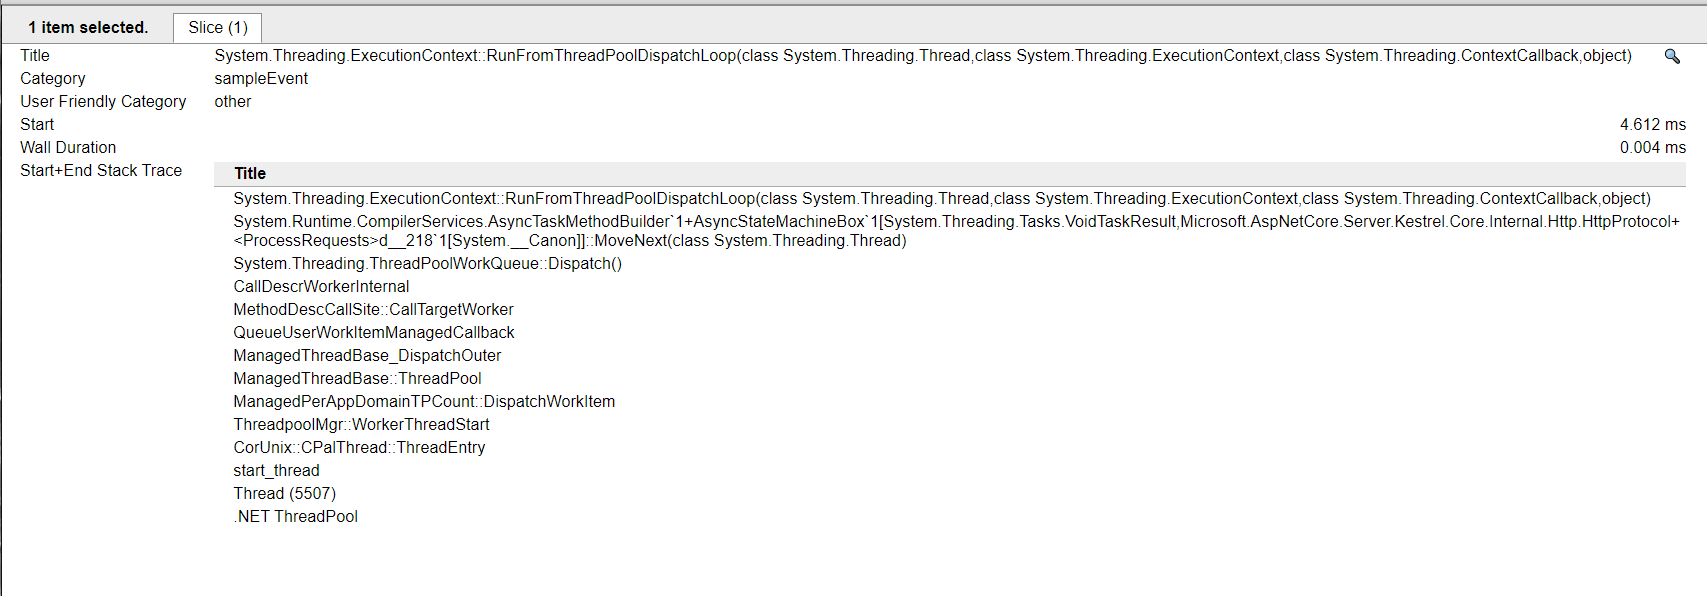
@adamsitnik this is great. Does the chromium view show you stacks? |

Member
Author
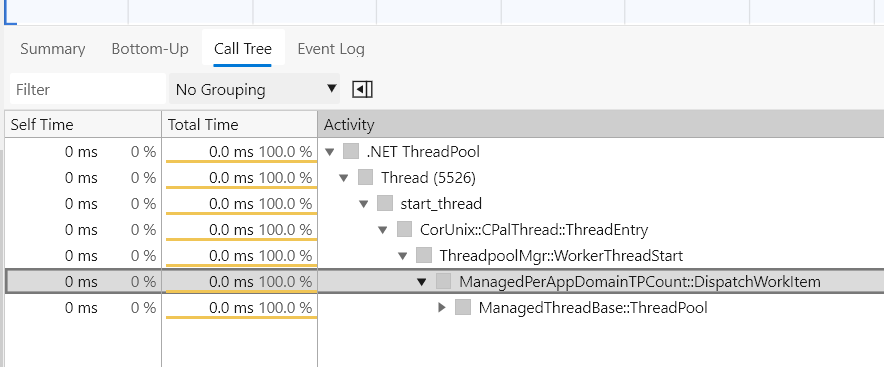
Yes, when I select something from the graph (every sample is represented as event and it's clickable) in the
The "DevTools View" (F12) can also show it, but it requires the user to expand the call stack manually by clicking on the arrow ;/
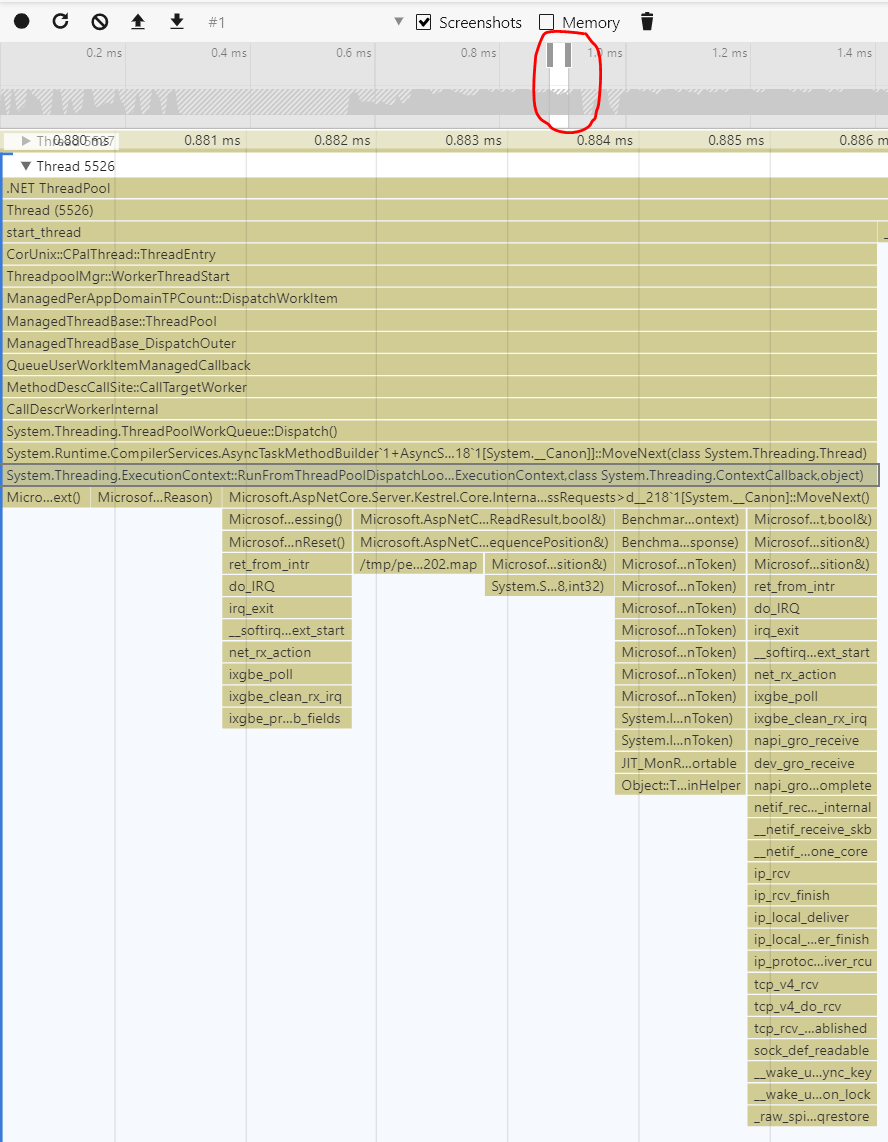
Also, if you zoom in the time you can see method names:
|
Member
|
That's awesome! Let me take a look at the code diff here and get back to you. |

brianrob
reviewed
Mar 6, 2020


This file contains hidden or bidirectional Unicode text that may be interpreted or compiled differently than what appears below. To review, open the file in an editor that reveals hidden Unicode characters.
Learn more about bidirectional Unicode characters
Sign up for free
to join this conversation on GitHub.
Already have an account?
Sign in to comment
3 participants


Add this suggestion to a batch that can be applied as a single commit.This suggestion is invalid because no changes were made to the code.Suggestions cannot be applied while the pull request is closed.Suggestions cannot be applied while viewing a subset of changes.Only one suggestion per line can be applied in a batch.Add this suggestion to a batch that can be applied as a single commit.Applying suggestions on deleted lines is not supported.You must change the existing code in this line in order to create a valid suggestion.Outdated suggestions cannot be applied.This suggestion has been applied or marked resolved.Suggestions cannot be applied from pending reviews.Suggestions cannot be applied on multi-line comments.Suggestions cannot be applied while the pull request is queued to merge.Suggestion cannot be applied right now. Please check back later.
While working on improving our results in TechEmpower I realized that we don't have any way of visualizing the work of all CPUs on a single screen using Linux. Speedscope is great, but it has a per-thread view and it's hard to diagnose threading issues. I was basically missing VS Concurrency Visualizer on Linux.
I've reminded myself about the work @josalem did in dotnet/diagnostics#447 (comment) to implement an exporter to Chromium Trace Event File format.
By using it I was able to quickly identify one major bottleneck and improve almost all TechEmpower benchmarks by 2-10% RPS (including the super-optimized Plaintext).
How to use it:
Go to chromium and type
chrome://tracing/(oredge://tracing/if you are using latest Edge)Choose "Load" from the top left corner, select the exported trace file and click open
An alternative: Go to Chromium, press F12 (to open Developer Tools) and choose "Load profile" from top left corner:
The Trace Event Format is very similar to speedscope and I was able to reuse 95% of speedscope exporter code and just extend it with the missing 5%.
This PR combined with #1112 is going to allow me to extend
dotnet tracewith the possibility to convert.nettraceand.trace.zipfiles to the new file format and improve our user experience on Linux./cc @brianrob @tmds @noahfalk