MRG, ENH - Plot optodes in plot_alignment for fNIRS channels #7747
Conversation
|
@rob-luke third times a charm, here is a nice clean PR finally as a start for plotting the optodes |
|
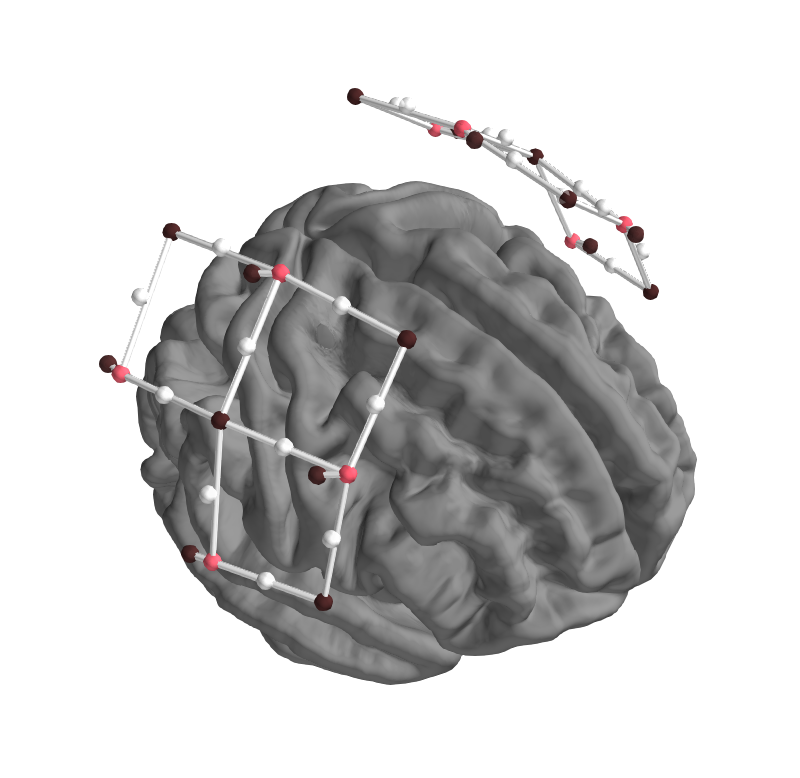
The attached figure looks great.
Like I mentioned in the other PR, I think red is an intuitive choice for an infrared emitter. Others would need to comment if black is already reserved.
I think this would be more appropriate for MNE-NIRS. Do these "banana" shapes usually represent the most probable photon migration path? If so, would we need to implement mne-tools/mne-nirs#62 first?
Yes, improving the |
Can you look at |
|
@rob-luke - just thinking of api now, you suggest: fnirs=('pairs', 'channels', 'sources', 'detectors') Is the idea with plotting the "channels" midpoint that this is where the data is assignment in the latter head plots in your analysis pipeline? |
|
maybe something like this: if fnirs is True:
fnirs = ['pairs', 'sources', 'detectors'] for xi, x in enumerate(fnirs):
_check_option('fnirs[%d]' % xi, x, ('channels', 'pairs', 'sources', 'detectors')) for key, picks in other_picks.items():
if other_bools[key] and len(picks):
if key == 'fnirs':
if 'channels' in fnirs:
other_loc[key] = np.array([info['chs'][pick]['loc'][:3]
for pick in picks])
if 'sources' in fnirs:
other_loc['source'] = np.array([info['chs'][pick]['loc'][3:6]
for pick in picks])
if 'detectors' in fnirs:
other_loc['detector'] = np.array([info['chs'][pick]['loc'][6:9]
for pick in picks])
other_keys = sorted(other_loc.keys())
logger.info('Plotting %d %s location%s'
% (len(other_loc[key]), key, _pl(other_loc[key]))) |
|
@rob-luke - this is ready for an initial review but I think everything wanted is in the current PR |
|
I would prefer to leave the default plotting option as it is. I think having the additional sources and detectors creates too much visual clutter (particularly when you extend this to multimodal datasets). Further, I think that having pairs and sources and detectors is redundant. So please leave the default as is, and if the users want the additional points they can pass in You will need to add some tests too. Previously this was done by checking that the correct items were listed in the logs. And there are still seems to be some debugging print statements in the PR. |
|
thanks @rob-luke good feedback, agree on the default changes, |
|
Tests tend to live in a |
|
@rob-luke - fixed the default behaviour and reverted the colour of the channels to the red it was before, fixed bug, and added tests of logs |
|
saw the tests, got my flake8 plugin working, and fixing these style problems now |
Great. It took me a for attempts to understand all the different tests, but after you've been through it once its easier. Having flake8 and pydocstyle installed locally saved me quite some time too. Following the process here... "When you believe a PR is ready to be reviewed and merged, convert it from a draft PR to a normal PR, change its title to begin with MRG, and add a comment to the PR asking for reviews (changing the title does not automatically notify maintainers)." Then people will review your code. |
|
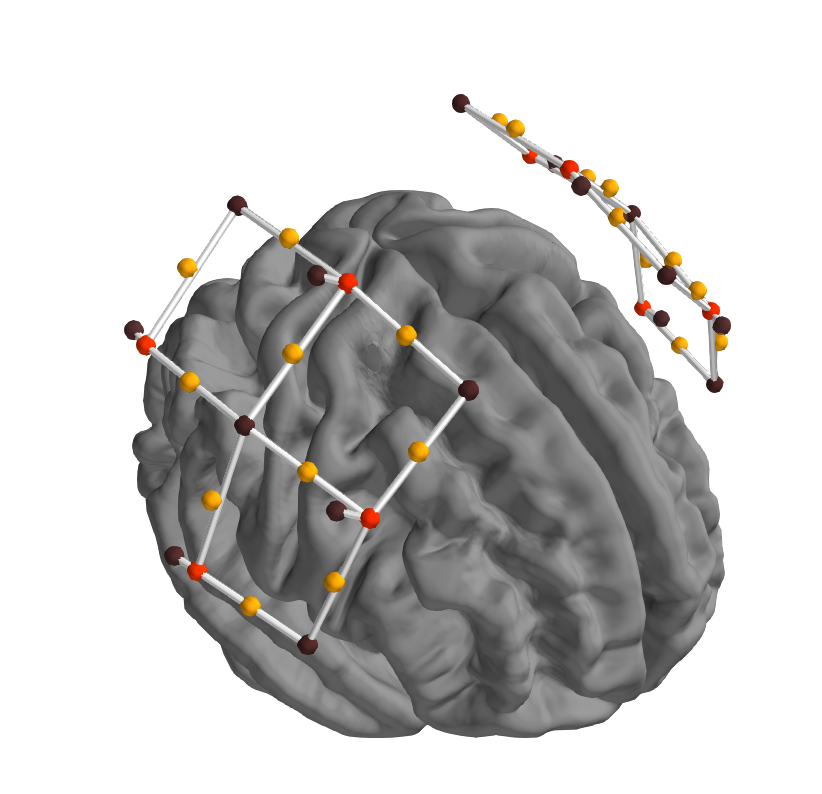
Thanks for sharing the figures. After looking at them I definitely don't like the white channels and white pairs, its too hard to see the channels. Currently my preference is for your original colouring (sorry to send you in circles), but somehow accentuating the difference between the red and orange. Perhaps get the tests passing, then when others review they can weigh in on the colours. |
|
ok thanks, looks like this for now while I work on tests |
|
Sorry about that @larsoner, Should be unchanged from master now, |
|
not sure what happened with the travis test: |
|
Fixed by #7764, I restarted the runs |
|
The updated tutorial figure looks great. Thanks @kylemath. |
|
Thanks @kylemath ! |
|
awesome thanks for the help learning, |
* upstream/master: (74 commits)
  FIX: Correct a bug in find_bads_eog (mne-tools#7797)
  [MRG] split_naming='bids' changes from _part-%d to _split-%d (mne-tools#7794)
  MRG, MAINT, DOC: Remove spyder (mne-tools#7796)
  MAINT: fixes for linkcheck (mne-tools#7762)
  [WIP] Update ieeg data example for ECoG (mne-tools#7768)
  fix examples/tutorials [circle full] (mne-tools#7786)
  MAINT: Clean up VTK and add to pre on Azure (mne-tools#7780)
  ENH: Add matplotlib animation support [skip travis] (mne-tools#7783)
  MRG, API: change out_type default in permutation_cluster_(1samp_)test (mne-tools#7781)
  DOC: docstring fixes (mne-tools#7777)
  MRG, ENH: Add tol_kind option (mne-tools#7736)
  MRG, DOC: Notes about info (mne-tools#7772)
  ENH: Speed up NIRx read without preload (mne-tools#7759)
  Minor plot_raw aes improvement (mne-tools#7770)
  MRG, FIX: Fixes for BEM contours (mne-tools#7763)
  MRG, STY: Fix E741 (mne-tools#7767)
  MRG, ENH - Plot optodes in plot_alignment for fNIRS channels (mne-tools#7747)
  FIX: Update NIH support [skip travis] (mne-tools#7766)
  MAINT: Bump tol for gamma map test (mne-tools#7764)
  MRG, FIX: Fix MRI orientations (mne-tools#7725)
  ...
Reference issue
Example: Addressing discussion in other PR on loading BOXY data here: #7717.
What does this implement/fix?
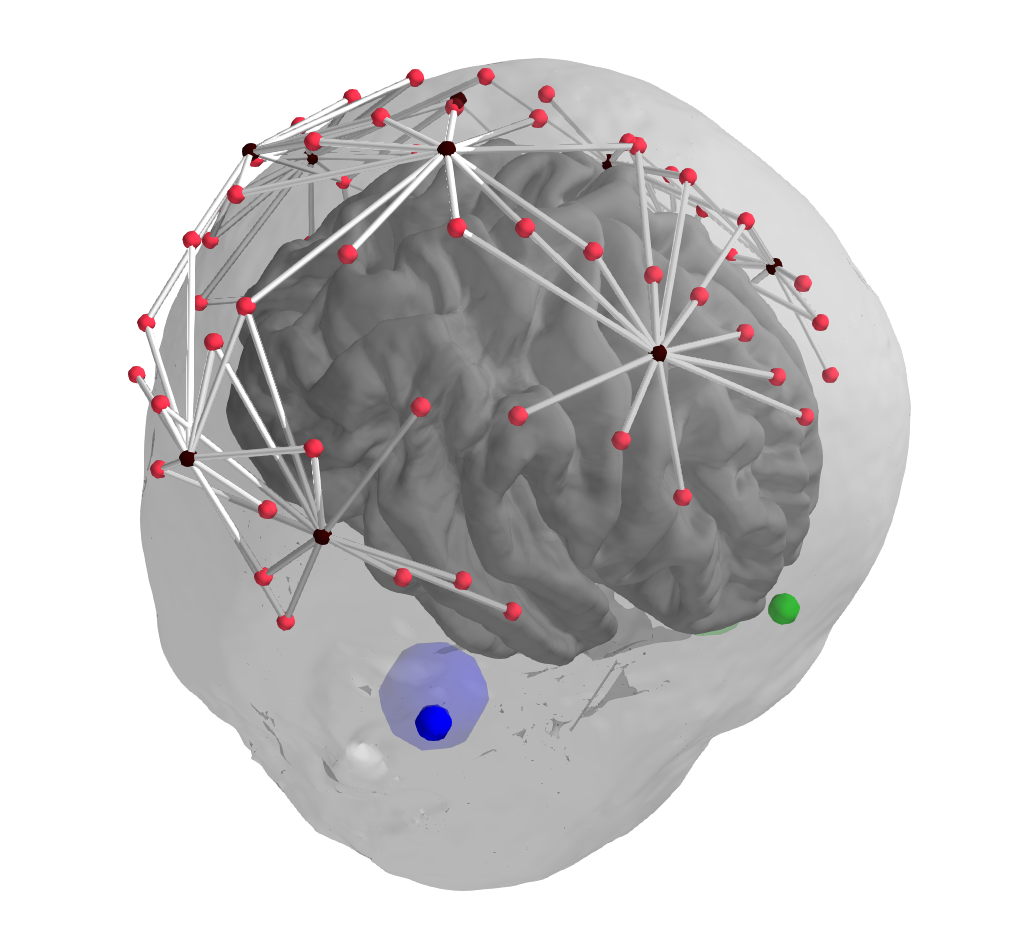
In addition to plotting the midpoint of source and detector, the source and detector locations should also be plot-able, to evaluate coregistration. Plotting is done in plot_alignment based on other_picks.
Example of desired output currently working in first pass, black are detectors, red sources, midpoints not shown: (-Colours - what is reserved, what is good?, )
First try by creating two new keys in other_loc based on other points, resetting other_keys, and adding colours and scales to the DEFAULTS
Additional information
Potential API needed to add:
@rob-luke says:
Currently plot alignment takes the arguments fnirs=('pairs', 'channels'). You could open another PR to extend this to fnirs=('pairs', 'channels', 'sources', 'detectors')?
@rob-luke says:
Currently channel plotting uses other_picks, you would need to extend the code to plot ['loc'][3:6], and ['loc'][6:9] based on if sources or detectors was passed somewhere around here https://github.com/mne-tools/mne-python/blob/master/mne/viz/_3d.py#L1039
Other ideas outside scope
perhaps think about plotting banana shaped path between source and detector instead of shortest path (easiest way is the 3d shape made by a string of spheres: https://github.com/kylemath/MOpt3d/blob/master/setuplookup.m)
perhaps think about plotting path along scalp curve instead of shortest linear path